Gold Price Hits 6-Year High Over $1400, ETF Buyers AWOL as Comex Trading Spikes
 Bullion.Directory precious metals analysis 21 June, 2019
By Adrian Ash
Head of Research at Bullion Vault
Silver failed to rise as fast as gold prices, adding 2.8% for the week at $15.30 but taking the Gold/Silver Ratio of the two precious metals’ relative prices up to a new 26-year high of 91.
Also used mostly in industry, rather than for investment or jewelry, platinum prices barely moved meantime, showing no change from last Friday’s finish at $804 – a 10-year low when first reached in June 2018.
Factories in world No.3 export nation Japan are seeing their sharpest fall in new orders for 3 years so far this month, the IHS Markit PMI survey said.
Manufacturers in No.2 export nation Germany have now seen export orders fall for 10 months running.
“The dovishness of the Fed and ECB, geopolitical tensions in the Middle East, and a technical breakout above $1350 with volumes gave strong support for the metal,” Reuters quotes analyst Jigar Trivedi at Anand Rathi Shares & Stock Brokers in Mumbai.
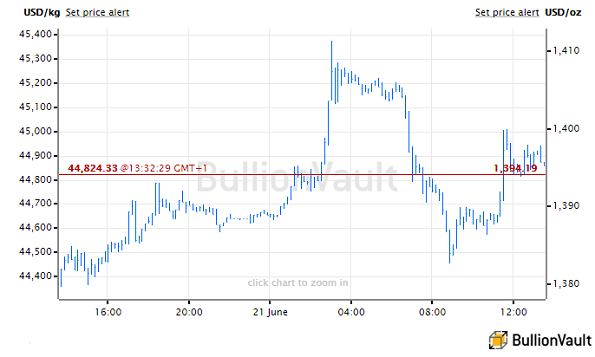
Gold priced in Dollars surged overnight to its highest since August 2013 at $1411 per ounce – up 21.6% from last July’s retreat to that year’s gold crash lows – before falling back only to re-try $1400 again in early London trade.

Gold’s overnight spike to 6-year highs came 1 hour before the New York Times reported that US President Trump approved and then backed down from air-strikes on Iran.
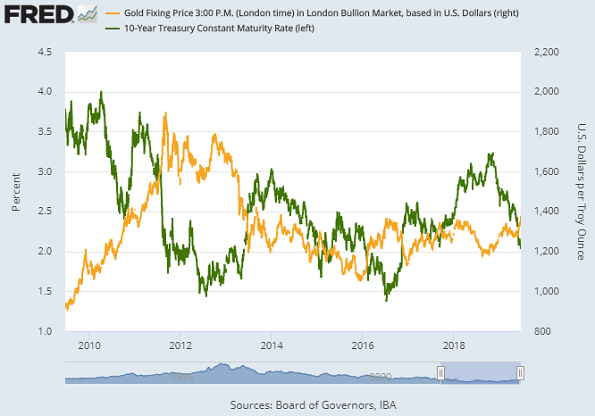
It coincided with 10-year US Treasury yields falling for the second time in 12 hours through 2.0% per annum, its lowest since Trump’s victory in the November 2016 presidential election.
Thursday’s 10-year yield dip below 2% saw the S&P500 index of US stocks close at its first new all-time high since April.
Week-to-week over the last 40 years, gold prices have moved in the opposite direction to 10-year US yields 54% of the time.
That has risen to 72% of the time so far in 2019.
The stock market has moved opposite to yields 49% of the time since 1980, but that connexion has fallen to 44% so far in 2019.

“Supply-demand fundamentals are turning supportive,” reckons a note from Australian bank ANZ, “with slowing mine-supply growth and improving physical take-off.”
But Thursday saw zero growth in the size of North American-listed gold ETFs – with shares in issue for the 7 largest such products, led by the GLD, all holding unchanged as bullion prices surged 2.6% in Dollar terms – while BullionVault, the largest online market for Western private investors in physical gold, continued to see heavy profit-taking overall.
With barely one-quarter of working days left in June, US Mint data say that total sales of gold Eagle coins are running 60% below May’s, showing the weakest demand (outside of December’s seasonal lull) since March 2018.
Trading volume in Comex gold futures in contrast leapt Thursday to its heaviest so far this month while volume in options on those contracts – involving no physical gold whatsoever – jumped 60% from Wednesday’s figure to total twice June’s average daily options volume so far.
On the supply-side meantime, gold prices for No.1 mining nation China also set a 6-year high along with No.4 the United States overnight, while No.2 Australia saw a fresh all-time high, No.3 Russia saw gold’s multi-year uptrend continue, and No.5 Canada saw gold reach its highest since the all-ti,e top of summer 2011.
Euro gold prices meantime spiked in Friday’s Asian trade to their highest since end-March 2013 at €1248, up 23.3% from last September’s 33-month lows.
Peaking at £1109, the UK gold price in Pounds per ounce touched its highest since October 2012.
Up 60% from the multi-year lows of end-2015, the British Pound gold price has only fixed higher in London’s wholesale bullion market on 39 trading days in history, all but 1 of them between August 2011 and Feb’ 2012.
US gasoline prices meantime jumped almost 4%, reaching their highest so far this month according to Bloomberg data, as firefighters fought a massive blaze at the Philadelphia Energy Solutions refinery in south-west Philadelphia, part of the eastern seaboard’s largest oil processing complex.
Bullion.Directory or anyone involved with Bullion.Directory will not accept any liability for loss or damage as a result of reliance on the information including data, quotes, charts and buy/sell signals contained within this website. Please be fully informed regarding the risks and costs associated with trading in precious metals. Bullion.Directory advises you to always consult with a qualified and registered specialist advisor before investing in precious metals.


 Material provided on the Bullion.Directory website is strictly for informational purposes only. The content is developed from sources believed to be providing accurate information. No information on this website is intended as investment, tax or legal advice and must not be relied upon as such. Please consult legal or tax professionals for specific information regarding your individual situation. Precious metals carry risk and investors requiring advice should always consult a properly qualified advisor. Bullion.Directory, it's staff or affiliates do not accept any liability for loss, damages, or loss of profit resulting from readers investment decisions.

Leave a Reply