Gold Bullion Leaves GLD Again But ‘Likely to Test’ 2011 Downtrend as Dollar Falls
 Bullion.Directory precious metals analysis 25 July, 2017
By Adrian Ash
Head of Research at Bullion Vault
Ten-year US Treasury yields touched 1-week highs at 2.29% as bond prices fell ahead of tomorrow’s US Federal Reserve decision on monetary policy – widely expected to leave rates and QE holdings unchanged.
Despite yesterday’s rise to 1-month US Dollar highs in the gold price, Monday’s close saw another outflow of gold from the bullion backing the SPDR Gold Trust (NYSEArca:GLD), as shareholders again liquidated stock from the largest exchange-traded vehicle for tracking the metal.
The world’s largest ETF of any kind at its peak 2011 value, the GLD has not had a day of bullion inflows in almost 1 month, shrinking by 6.6% since 26 June as gold prices first lost and then regained 4.0% against the Dollar to trade back at $1255 per ounce on Monday.
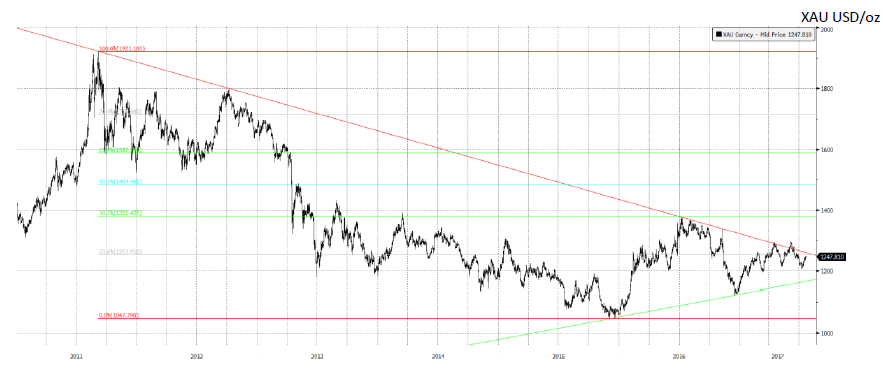
Technical analysis says “Gold [is] looking to break out of downtrend since 2011 nominal high,” writes Mitsubishi’s strategist Jonathan Butler in his latest quarterly report for clients of the Japanese conglomerate.
“Gold has already tested the red downtrend line that has prevailed since the 2011 nominal high and is likely to test it again soon.”

Looking at investment demand, “Rising US real [bond] yields may temper gold’s upside in Q3,” says Butler, but “the Dollar will remain on the back foot if US political deadlock continues…which will help support USD denominated gold.
“Elevated risks of an equity pullback could help gold as a haven,” Butler goes on, but from the key Asian consumer markets “physical demand for gold has been mixed so far this year.”
China’s first-half gold consumption data are due shortly from the government-mandated China Gold Association.
Legal gold imports to No.2 consumer India “more than doubled” by value in the April-to-June quarter from a year earlier, LiveMint reports, reaching $11.3bn.
Former No.4 consumer nation Turkey – pushed into 5th place by Germany behind the US since 2015 – meantime saw its trade deficit yawn 43% wider in May from 12 months earlier, “mainly due to a strong 237% y/y growth rate in imports of gold and other precious metals to $2.23bn,” says Intellinews, summarizing TUIK figures.
“The second half is likely to be stronger in India during the post-monsoon wedding season,” says Butler at Mitsubishi, now expecting gold to average $1250 per ounce in 2017 and $1300 in 2018.
Year-to-date, gold has averaged $1236 per ounce, rising from a New Year low of $1151 to a June peak at $1293.50 on the daily LBMA Gold Price benchmark.
The London Metal Exchange (LME) today told Reuters that it will challenge the LBMA benchmark’s global dominance by publishing gold and silver reference prices – also taken at 10.30am and 3pm in London for gold, and 12 noon for silver – based on trading of its new futures contracts.
The move “follow[s] a number of requests from key precious metals market participants,” the LME claims.
The LME’s spot gold contracts have gained 3.3% in Dollar terms since launching a fortnight ago yesterday, rising on 7 of those 10 trading days.
Data show the 12-month contract on LMEprecious rising from a contango above spot of $18.00 per ounce to $18.80 over that time.
Comex gold contracts – the world’s most heavily traded futures referencing gold bullion – have in contrast gone from a $21 one-year contango to $20.20 over that time.
Bullion.Directory or anyone involved with Bullion.Directory will not accept any liability for loss or damage as a result of reliance on the information including data, quotes, charts and buy/sell signals contained within this website. Please be fully informed regarding the risks and costs associated with trading in precious metals. Bullion.Directory advises you to always consult with a qualified and registered specialist advisor before investing in precious metals.


 Material provided on the Bullion.Directory website is strictly for informational purposes only. The content is developed from sources believed to be providing accurate information. No information on this website is intended as investment, tax or legal advice and must not be relied upon as such. Please consult legal or tax professionals for specific information regarding your individual situation. Precious metals carry risk and investors requiring advice should always consult a properly qualified advisor. Bullion.Directory, it's staff or affiliates do not accept any liability for loss, damages, or loss of profit resulting from readers investment decisions.

Leave a Reply