

Today we’ll take a second look at GLD deviation, take a look at the GDX, HUI, and I’ll offer some helpful technical analysis tips
 Bullion.Directory precious metals analysis 12 February, 2015
By Terry Kinder
Investor, Technical Analyst
On January 28th, in GLD Deviation Ends Friday the 13th we examined the fact that the GLD was three standard deviations above its linear regression line. At this point, barring a giant leap higher, GLD should stay within its downward price channel, vindicating the headline of the original article.
Last night, I ran across a video update from The Daiy Gold that covers the GDX and the HUI. While I have the highest respect for Jordan Roy-Byrne at The Daily Gold, I don’t completely agree with his analysis.
Later in this article, we’ll take a look at his video analyzing the HUI and GDX and I’ll highlight some differences I have in terms of technical analysis. I hope these ideas and tips will help you be able to better analyze and / or evaluate the many charts you will run across on the Internet. But first let’s update GLD deviation.

GLD Deviation Update
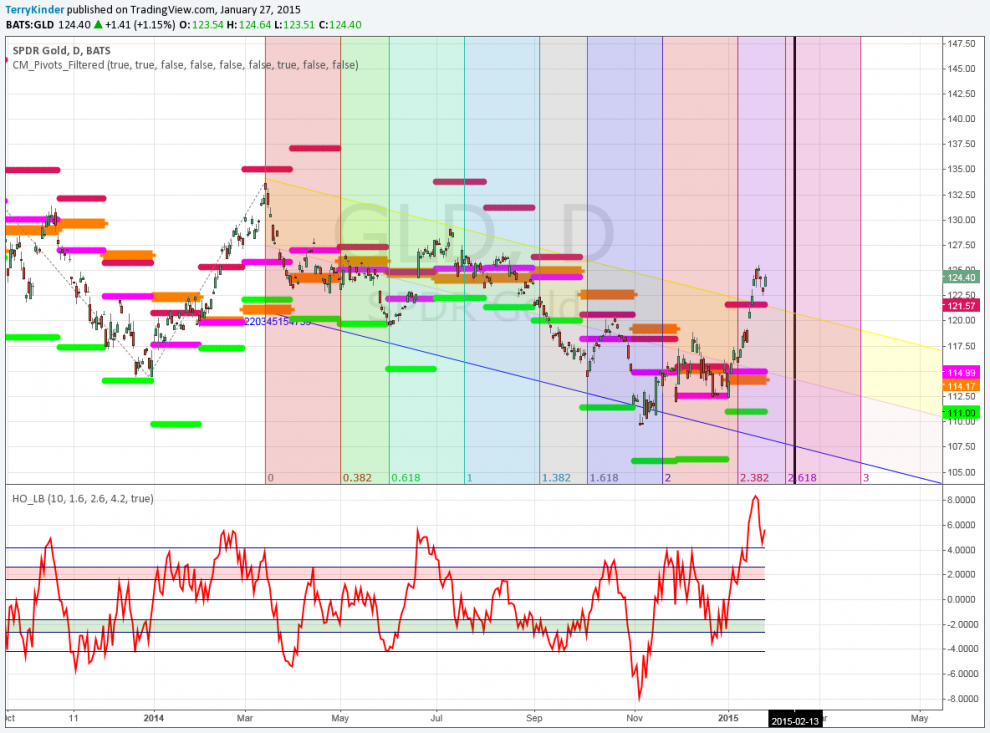
The GLD price is currently three standard deviations above its linear regression line.
Above is the chart that appeared in the original post. The price of GLD was very stretched and stood at 3 standard deviations above a linear regression line. It had also reached an extremely overbought level on the Hurst Oscillator, well above the pink shaded band. It seemed fairly clear (although there is always some degree of doubt) from the chart that the GLD price would fall back into the price regression channel. The date I chose for this to occur was Friday the 13th of this month.
So, what happened?
Barring a dramatic move higher in price, it appears GLD will still remain within the price channel on Friday the 13th of February.
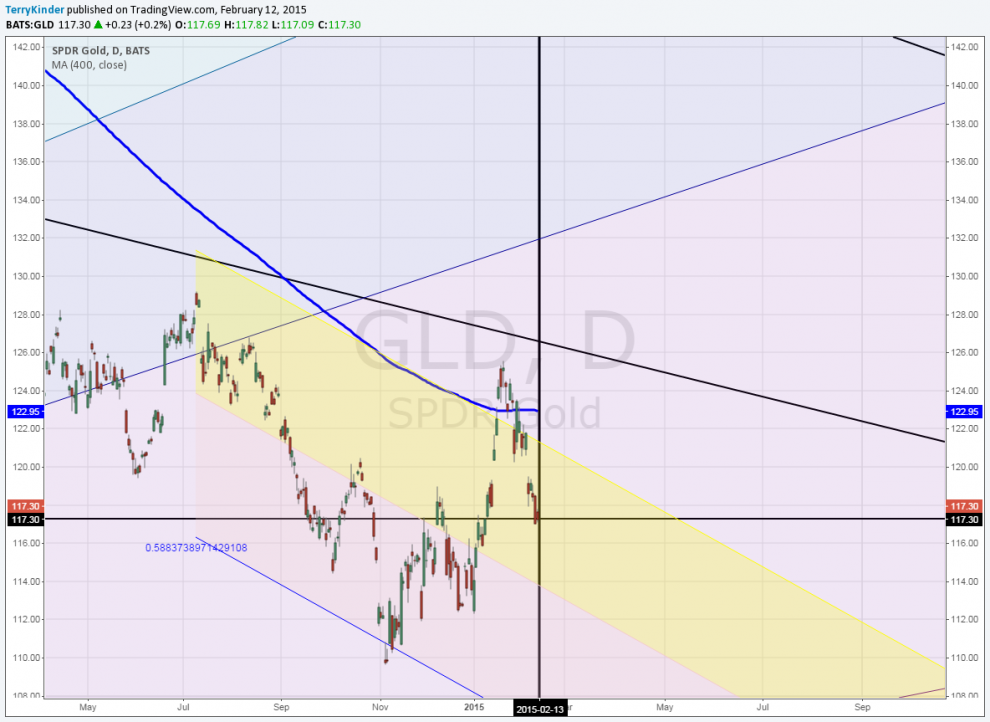
Unfortunately, I lost my original chart, but the above chart has exactly the same price regression channel in it as the original. As you can see price has dropped back well within the channel. The black vertical line marks Friday the 13th of February. So, barring a dramatic rise in price there’s a good chance price will still remain within the channel tomorrow.
If you read the original article you may remember that I tied the movement of the GLD price to another potential investment.
I have a mystery and mirror opposite investment in mind should time and price meet where I expect them to, but you’re going to have to wait until Friday the 13th to see if the GLD price drops back into the descending price channel. The investment I have my eye on appears to be bottoming. One confirmation that it is indeed bottoming will be the price of GLD moving back down within the price channel.
There’s a pretty good chance that either tomorrow on Friday the 13th or Monday the 16th that I will make a decision to enter my mystery investment. At this point it will have to remain a mystery, but at some point I will definitely let you know whether or not I make the investment and either how it is going or how it went.
The Daily Gold Analysis of the HUI and GDX
Jordan Roy-Byrne of The Daily Gold recently offered an analysis of the HUI and GDX. There are several reasons why I think this kind of analysis is important:
1) Anything related to the gold market tells us something about the health of the overall gold market and gives us an idea where the gold price might be headed;
2) Through watching technical analysis videos, reading articles, etc. we can learn new techniques and learn about indicators, moving averages, etc. that we can add to our own tool kit to strengthen our analysis;
3) Critically viewing charts and analysis we can discover weaknesses and use that knowledge to improve our own analysis in the future.
Below follows a summary of the points Jordan Roy-Byrne makes in the video and my thoughts, if any, on them.
GDX
1. The video starts by highlighting the 400-day moving average. Roy-Byrne says that the 400-day moving averages is one of the most important moving averages.
Comment: I haven’t really used the 400-day moving average much in the past. After watching the video I went ahead and put it on several charts. One of the reasons I like to watch or read analysis is because I usually find that I learn something I wasn’t aware of before.
2. It appears possible the GDX may have made a double-bottom according to Roy-Byrne. He describes the bottom as a firm base.
Comment: I think it’s always possible that the analysis of the double-bottom could be correct. On the other hand, from a technical perspective, I would like there to be some other confirmation that this is true. For example, a price break above the 400-day moving average could be one possible confirmation that the price has indeed bottomed.
In addition, however, a second confirmation would be even better. Perhaps the price moves above another support level, whether that be a Fibonacci retracement, extension, a level on a Pitchfan, etc.
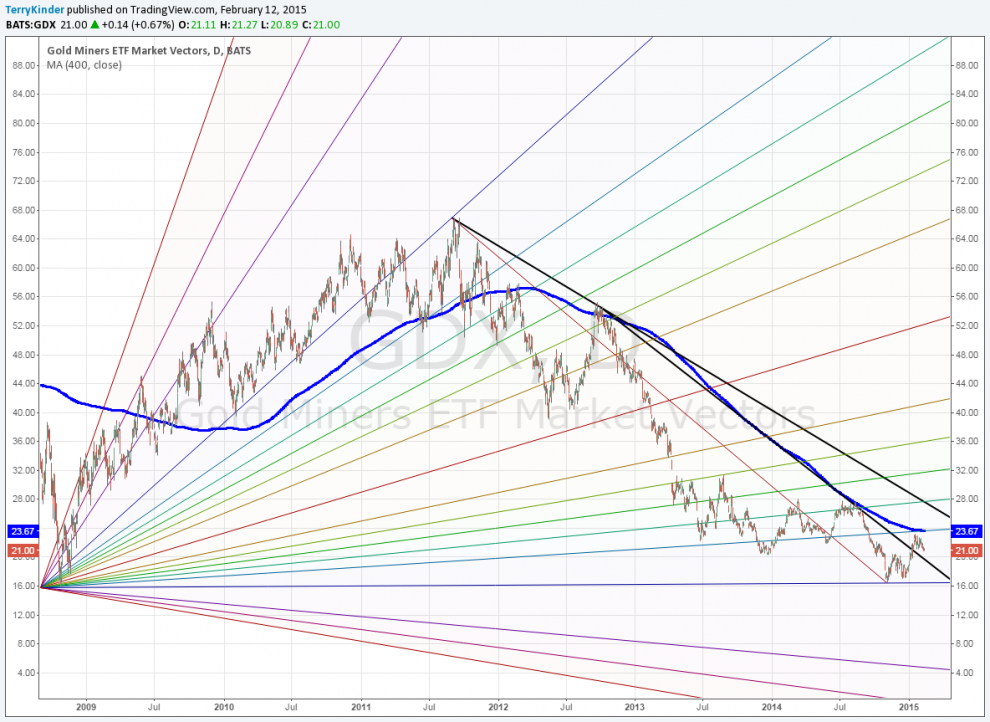
On this Pitchfan chart, the GDX has so far failed to move above both the next resistance level and the 400-day moving average.
In the chart above you can see that while the price did break above one resistance line drawn from an interim price peak, it has not yet moved above either the next Pitchfan resistance level or the 400-day moving average. In addition, it has yet to overcome the resistance line drawn from the all-time high in the GDX price.
So, while it is well and good to have identified what we believe may be a double-bottom, there hasn’t been any other significant confirmation that the GDX price is going to move higher. It is always good practice for the technical analyst to identify price action that would confirm or negate whatever their idea is of the price direction.
3. Additionally Roy-Byrne comments that the current bear market in gold is over 4 years old. It is the second longest bear since 1942. The price decline of the current bear is one of the largest. For the above reasons Roy-Byrne believes it is more likely that gold will re-enter a bull market than not.
Comment: There can be a fine line between analysis and opinion. I think the above comments straddle that line. All of these facts are potentially supportive of the idea that a new gold bull market will begin. Unfortunately, they are not really quantifiable or measurable. How long and how steep does a bear market have to be? If we had a standard, then we wouldn’t have to work so hard as technical analysts to determine price direction. We could just simply say gold has declined for X number of years, Y percent, therefore the bear market has to end. I’m extremely wary of statements that imply a bull or bear must start. Such statements lack a technical basis which is necessary to be able to reasonably assess which direction price is moving, as well as whether the market remains bearish or is becoming more bullish.
4. Roy-Byrne notes that the 400-day moving average of the GDX has been tested more frequently recently and says this is a potential sign that price could move higher. He also says that if price moves above the 400-day moving average it will spell a new bull market for mining stocks.
Comment: You only have to look back to 2012 on the chart above to see that the GDX price moving above the 400-day moving average doesn’t necessarily mean that the GDX will have entered a bull market. Moving averages are sometimes violated to the upside in failed price breakouts. As the GDX chart currently stands I would like to see both a price break above the 400-day moving average as well as a move above the next Pitchfan resistance level. Better still would be price breaking above the multi-year price resistance line. Again, more confirmations, in my way of thinking, are better.
You have to put things in terms of the chart rather than making them into simple statements. Simple statements about if X happens then Y will follow are made all the time by commentators and some technical analysts. To me, they really aren’t helpful. You need to be able to point to something on the price chart that must happen. Hopefully, you can point to several things that should or must happen to confirm an uptrend, new bull market, etc. Don’t rely on just one simple event to determine that the direction of price has changed. It is too easy to be fooled by a price head fake.
HUI
1. Roy-Byrne says that the HUI bottomed around 150 and then spent about three months testing the bottom. In addition the 150 level has provided support for several years. Before that, 150 acted as resistance.
Comment: Certainly I would agree that 150 has acted as both price resistance and support. Identifying support and resistance is one of the fundamental skills that technical analysts, traders, etc. need to have. However, you shouldn’t assume that support has to hold. One old saw about support is that the more times it is tested, the more likely is that it will eventually be violated to the downside. So, while you certainly want to identify support and resistance, you don’t have to be married to those levels.
Here is an example in the HUI monthly Pitchfan below to consider:
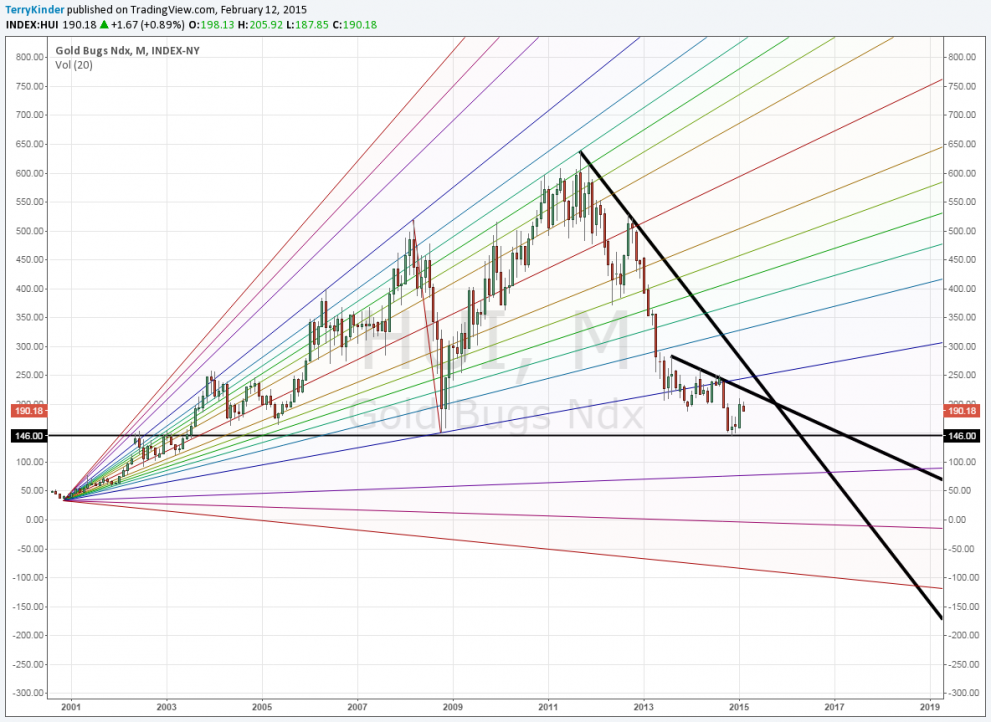
The HUI has several different resistance levels to break through before price can move higher.
A few noticeable things about the chart are: 1) You have a large triangle shaped pattern that price will either move above or below the apex; 2) There is a second, smaller triangle pattern; 3) You have a longer-term price resistance line that GDX has, so far, failed to break above.
Not as noticeable, perhaps, it the Pitchfan resistance line that runs over to the right of the chart that exits our view a little over 300.
There is a horizontal line drawn at 146 which marks the lowest level for the HUI as of late. So the difficulty for the HUI is that price is running out of real estate in a sense. If it can’t break above the apex of the big triangle and fails to at least cross above overhead price resistance, it’s probable price will continue to fall, endangering the supposed double-bottom near 150.
Even if price meanders sideways within the small triangle, a day of reckoning still lies ahead. As a technical analyst my assumption is (and I don’t make many) that price will continue to move with the long-term trend until something acts on it to reverse the trend. So, the price bias is down. If you put a gun to my head and ask which way do I think price breaks out of the triangle I would say lower. That is what the price direction has been saying and will continue to say until something acts to push price higher. Rather than assume price has to reverse higher because of a double-bottom, it’s better to wait for price to “prove” it is moving higher. Let it break above a triangle apex or violate the downward price resistance line.
Be aware of the likelihood that price could likely pause at the next Pitchfan resistance level. None of this is to say that the HUI won’t move higher. But instead of assuming it will, demand for the price action to demonstrate that it is indeed moving higher.
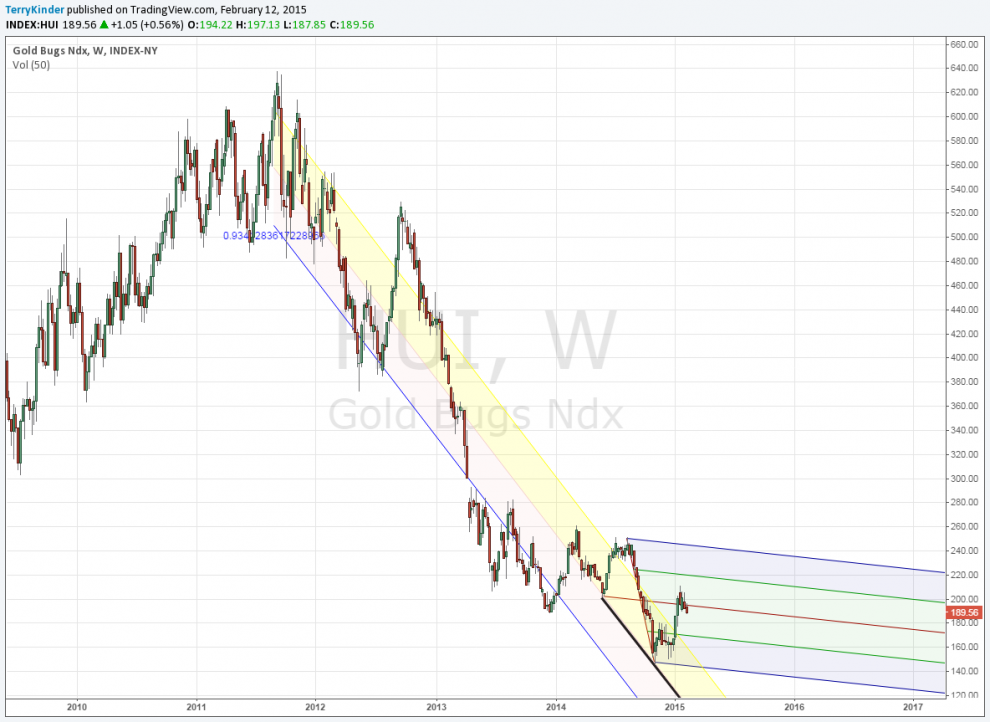
The weekly HUI is still trending down, albeit more slowly than before.
Above is a slightly different technical take on the HUI. Starting in 2011 the HUI declined steeply, largely remaining within a price channel. Later it broke out of the channel, moving sideways. You’ll notice that the price has remained within a pitchfork. However, price moved above the red median line and then fell back below it, indicating price weakness.
2. Jordan Roy-Byrne, at the end of discussing the HUI, outlines what a possible move higher might look like.
Comment: This is actually one of my least favorite things that technical analysts do. I have lost count of the number of times I have seen such drawings of where the price is “expected” to move, only later to check back and see that the analyst was incorrect. I simply think such things let bias creep in and are a waste of time for both the analyst and anyone who uses their chart.
Correlations, ratios, gold priced in other currencies
Roy-Byrne makes some interesting observations about gold priced in Canadian Dollars, the gold oil ratio and the relationship between the gold price and industrial metals prices.
Comment: I think all of these ways of looking at things can be useful. However, they do reveal certain assumptions he is making. For instance, he is assuming that the demand for gold at least remains static if not higher than current levels. Roy-Byrne outlines how an increasing gold price in Canadian Dollars is good for Canadian miners and how lower oil prices should help reduce costs for miners.
However, that leaves to one side all of the other factors which might affect the gold price. Anything from demand to the degree of confidence citizens have in their governments, the economy, etc. can influence the gold price. So, lower input costs, on balance, will be good for miners, if all things are held constant. But, if the demand side changes for some reason, then those benefits may be insignificant.
Again, all of this simply highlights why I prefer technical analysis to fundamental analysis. We could go back and forth for thousands upon thousands of words, pages, and years attempting to define the fundamental factors that will determine if mining companies will be more profitable or not. Even if we agree on every single fundamental (something which is nearly impossible to imagine) something completely unknown can enter the picture and demolish our fundamental considerations.
On the other hand, technical analysis can examine price only since it encapsulates all of the knowledge that thousands or millions of people possess about miners, gold, mining stocks, the economy, etc. We don’t need to become experts on the intricacies of miners, mining, the economy, regulations and every political jurisdiction on earth where miners mine for metals. Instead, we merely need to concentrate on price and its role as a signaling mechanism for others to make decisions. It still isn’t an easy task, but it is much simpler than trying to know absolutely everything there is to know about mining.
GLD bonus charts
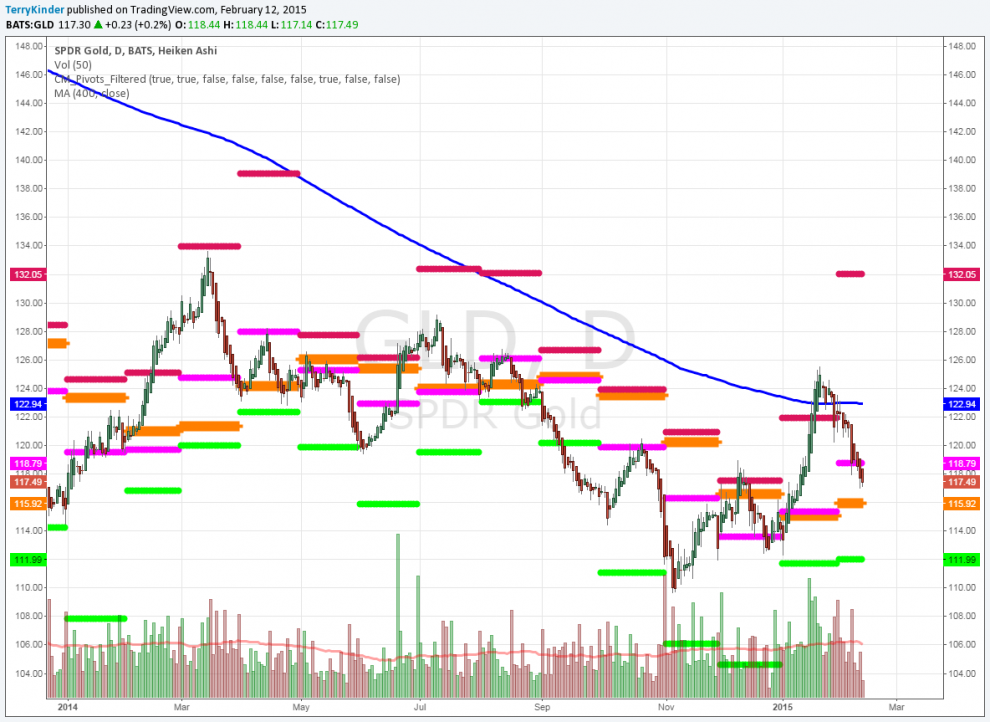
GLD, on this daily pivot has broken one support level. The next support level stands at $115.92.
In the chart above, the GLD price broke below support at $118.79. The next support level is at $115.92.
This chart also provides an excellent idea why it’s dangerous to assume that just because a moving average is violated price will move higher. In this case the 400-day moving average was penetrated but price quickly moved back down below it, only to violate a pivot support level as well.
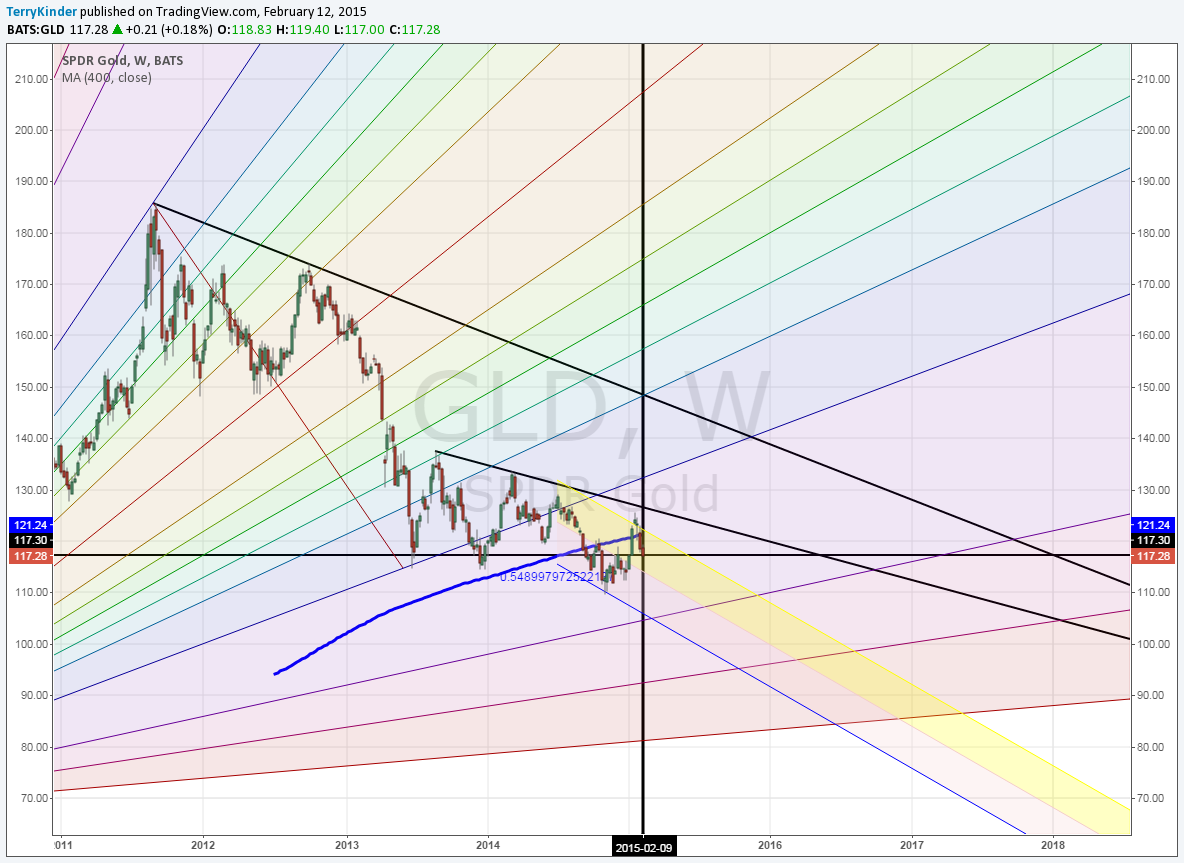
On this weekly GLD chart you can see the price has fallen below the 400-day moving average. Also visible are two price resistance lines.
In the above chart you can see that the weekly GLD price has fallen below the 400-day moving average. It has also been unable to break above price resistance dating back to 2013. Price still remains within the yellow and pink shaded price regression channel.
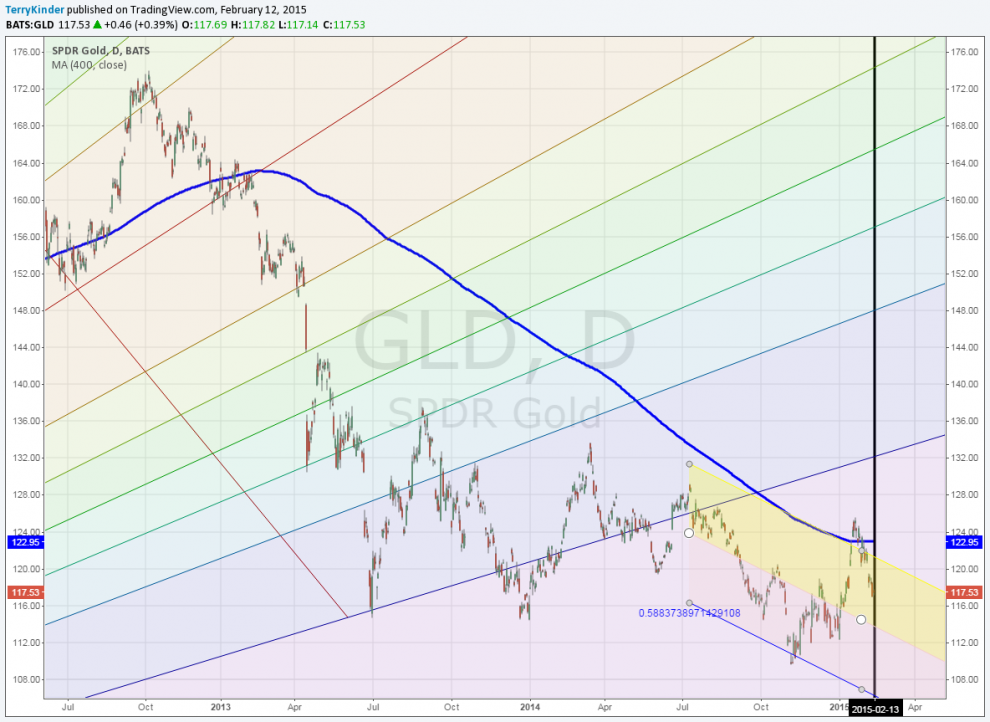
You can clearly see the GLD price head fake on this daily chart.
In our final chart you can clearly see where GLD did a head fake – moving above the 400-day moving average, only to quickly fall below it. GLD is now well within the price channel and, barring a substantial jump in price, is likely to remain within it on Friday the 13th of February.
Conclusion
1. It looks like GLD will remain within it’s price channel on Friday the 13th of February;
2. The 400-day moving average is a very useful indicator to follow as it often indicates important turns in price;
3. One of the best ways to learn about technical analysis is to study the works of others and learn from the strengths and weaknesses of their analysis;

Learning to analyze price charts takes time, but is well worth the effort. Image: pixabay
4. Don’t assume just because a price crosses above or below a moving average that it necessarily indicates a change in trend. It could, but look for other confirmations before investing;
5. Rely on things you can see clearly on the charts rather than generalities and what someone claims is a fundamental factor affecting the price;
6. Technical analysis of price allows you to capture all of the knowledge of thousands, even millions of people possess about mining, stocks, currencies, etc. One of the shortcomings of fundamental analysis is that it is nearly impossible for people to first agree on all the fundamental factors affecting price, and second, anticipate other factors that may impact their fundamental analysis.
Technical analysis elegantly encompasses and encapsulates all of the information brought forward by fundamental analysis. Technical analysis has the added benefit of looking at just price. This allows the conscientious analyst to put aside any personal biases and focus on what price and other technical indicators point to with regards to price direction (and momentum).
Bullion.Directory or anyone involved with Bullion.Directory will not accept any liability for loss or damage as a result of reliance on the information including data, quotes, charts and buy/sell signals contained within this website. Please be fully informed regarding the risks and costs associated with trading in precious metals. Bullion.Directory advises you to always consult with a qualified and registered specialist advisor before investing in precious metals.


