What is the euro gold divergence and what does it tell us about the direction of the gold price?
 Bullion.Directory precious metals analysis 5 January, 2015
By Terry Kinder
Investor, Technical Analyst

Euro Gold Divergence: The euro priced in dollars has been declining while gold priced in dollars has risen. Typically these divergences resolve in favor of the dollar gold price, which would result in a climbing euro. Will that be the case this time? Image: pixabay
Gold is now making higher lows while the euro is making lower lows, and history shows that when the two disagree, it is usually the price of gold that ends up being right about where both are headed.
To me, the gold price has appeared pretty weak. On the other hand, several people over at Google+ have commented that, given the bearish sentiment on gold, they would have expected the gold price to be weaker. They have a good point as far as it goes. The flip side of the argument is that, given the perceived role of gold as insurance against elevated government and personal debt levels worldwide, and the continuing bond market skepticism of the economic recovery, why hasn’t gold been stronger? My answer to both sides of the argument would be that we are simply in a part of the gold cycle where the bias is towards lower gold prices, but I digress.
Euro Gold Divergence Chart

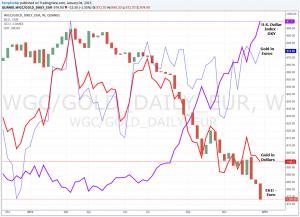
Euro Gold Divergence: Tom McClellan expects that the divergence in the euro priced in dollars vs. gold priced in dollars will be resolved in favor of higher gold prices.
A few things become fairly clear when looking at the euro gold divergence chart above: 1) As the U.S. Dollar Index (DXY) has gained altitude, the price of gold in U.S. Dollars has fallen pretty dramatically; 2) The same can be said for the U.S. Dollar in relation to the euro; and 3) a noticeable divergence has formed between the euro priced in dollars vs. gold priced in dollars.

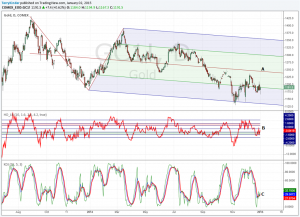
Euro Gold Divergence: Gold spent most of 2014 in a shallow decline as indicated by the Schiff Pitchfork. Price has bounced off the bottom of the pitchfork. The gold price is slightly out of oversold territory as indicated by the Hurst Bands at B. We’ll have a better idea of the strength of the gold price as it approaches the pitchfork midline at A. It it touches the midline and moves lower, that indicates price weakness. If it can push through the midline and head to the upper parallel line that would be a sign of strength.
What McClellan is saying fits in pretty nicely with what the above chart is showing. The price of gold in dollars rests within a descending Schiff Pitchfork which has a gentle slope downward. Normally, within the pitchfork we should expect that 80% of the time or so that price will move back towards and touch the Median Line at A. The price has wandered a bit aimlessly since March of 2014 – touching the upper parallel line of the pitchfork once, and the bottom of the lower parallel line multiple times. The two indicators – the Hurst Oscillator and KDJ recently were near the lower end of their range. Although both could potentially move lower, it would not be remarkable if they moved back up and we saw the gold price move back toward the Median Line between $1,225.00 and $1,250.00.
Until the gold price moves either above the upper parallel line or below the lower parallel line, the price appears to be rangebound, but with a bias toward a falling gold price over time.
We probably shouldn’t read too much into the euro gold divergence as it relates to gold prices in the medium or long-term. Short-term, if the divergence resolves in favor of the dollar gold price vs. euros priced in dollars, we could see the dollar gold price press higher. Expect the gold price to meet some price resistance near $1,235.30 or so should it manage to move above $1,212.26.
Bullion.Directory or anyone involved with Bullion.Directory will not accept any liability for loss or damage as a result of reliance on the information including data, quotes, charts and buy/sell signals contained within this website. Please be fully informed regarding the risks and costs associated with trading in precious metals. Bullion.Directory advises you to always consult with a qualified and registered specialist advisor before investing in precious metals.


 Material provided on the Bullion.Directory website is strictly for informational purposes only. The content is developed from sources believed to be providing accurate information. No information on this website is intended as investment, tax or legal advice and must not be relied upon as such. Please consult legal or tax professionals for specific information regarding your individual situation. Precious metals carry risk and investors requiring advice should always consult a properly qualified advisor. Bullion.Directory, it's staff or affiliates do not accept any liability for loss, damages, or loss of profit resulting from readers investment decisions.
