

With the dollar bouncing strongly today, it’s time for a dollar chart update
 Bullion.Directory precious metals analysis 6 February, 2015
By Terry Kinder
Investor, Technical Analyst
Since May of last year, the U.S. Dollar has been on a tear. Recently, however, it seems to have taken a breather. While massaged economic data seems to be alternately whipsawing the euro, then dollar higher and lower, we take a look a few dollar charts.
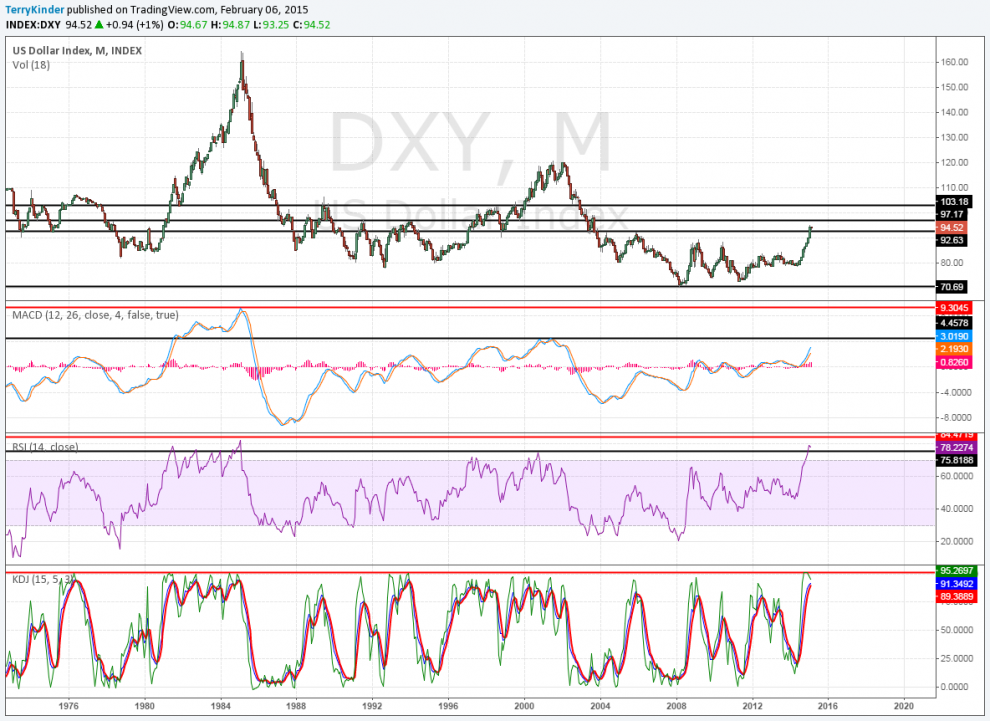
The dollar price broke out of an over decade long price channel.
Our first dollar chart above shows the buck breaking out of an over decade long price channel. So far the dollar has managed to stay above the channel. Should the dollar manage to hold onto its gains there is more overhead price resistance at $97.17 and $103.18.
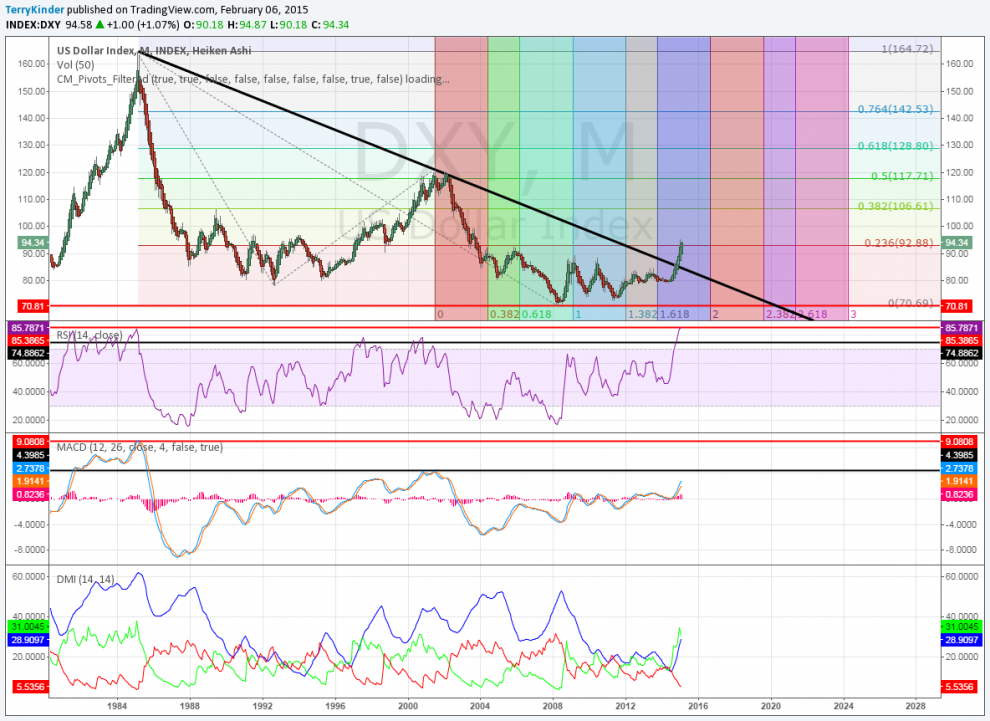
The dollar broke out of the triangle and technically may have room left to run higher.
In the chart above the dollar broke out of a triangle pattern and has since moved higher. It also cleared the first Fibonacci level at $92.88 or 0.236. The next resistance level is $106.61 or 0.382. Technically, on this monthly dollar chart, RSI is looking stretched. However MACD and DMI both look like they have room to run higher.

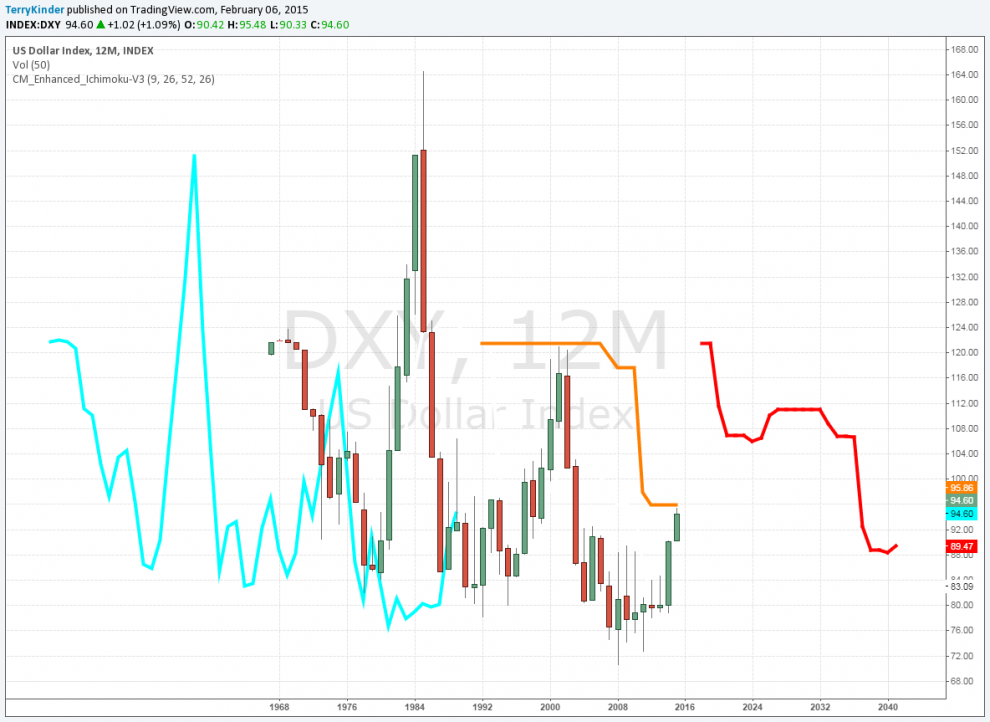
The dollar is presently capped on this yearly Ichimoku Cloud chart.
Pulling our time frame out to a yearly view, we can see the price is bumping up against overhead resistance on this Ichimoku Cloud chart. If the dollar price can move above the gold-ish colored line that could indicate a further advance higher is in the offing.
The dollar price has, thus far, not fallen back into the Schiff Pitchfork.
In the dollar chart above you can see that the dollar has, so far, been able to hold above the upper parallel line of the Schiff Pitchfork. The line should provide some price support. Should price break below the upper parallel channel, that would set up for a retest of the black support line and a re-visit of price to the red median line of the pitchfork between $86.00 and $87.00.
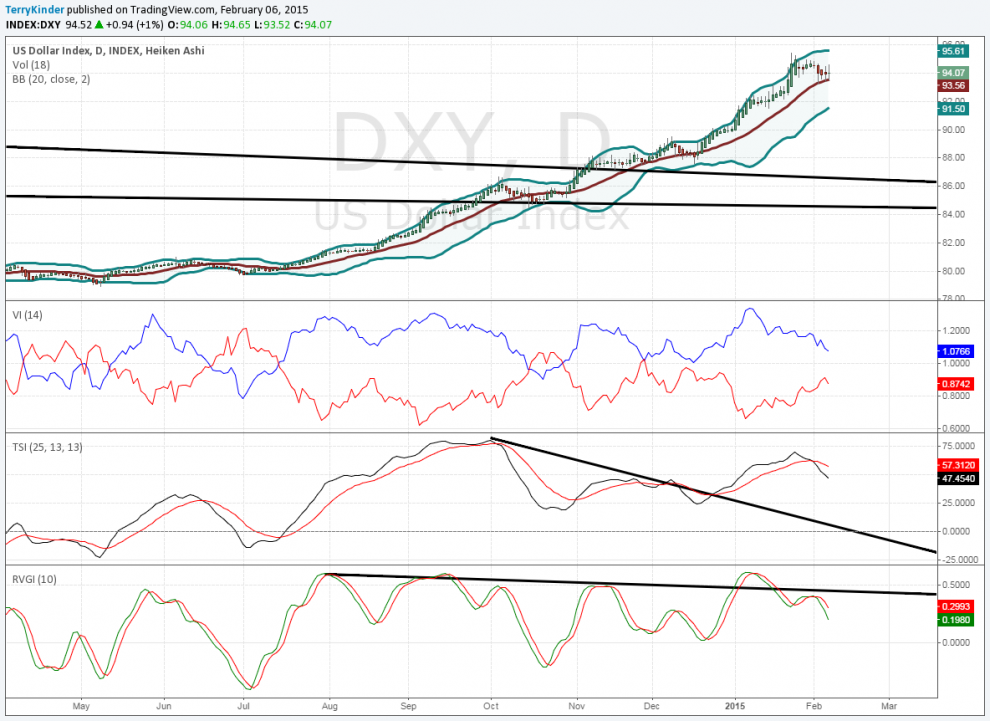
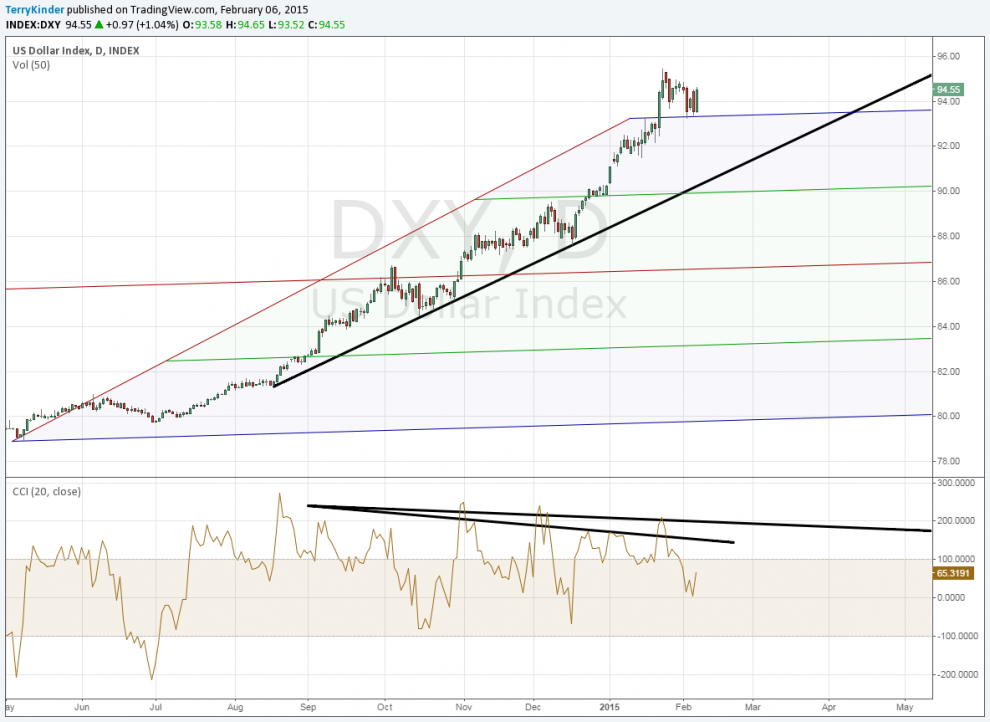
On the daily chart, the dollar’s technical indicators have weakened slightly.
On the daily dollar chart above, the U.S. Dollar has weakened just a bit, moving lower within the Bollinger Bands. The other indicators – Vortex Indicator, True Strength, and Relative Vigor are all weaker as well.
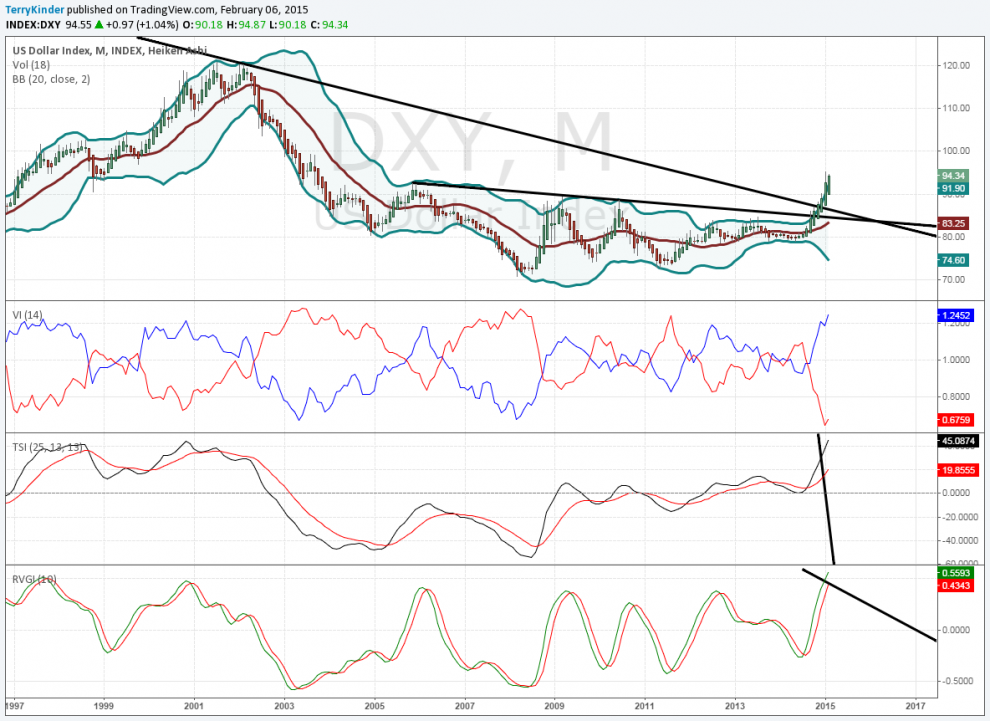
Although the technical indicators are stretched, it doesn’t mean the dollar won’t go higher.
The next chart above is simply the monthly version of the previous chart. On this chart, the indicators are indicative of the dollar’s strong move over the past few months. Technically, the dollar price movement looks a bit extended, but that doesn’t necessarily mean the price will move lower.
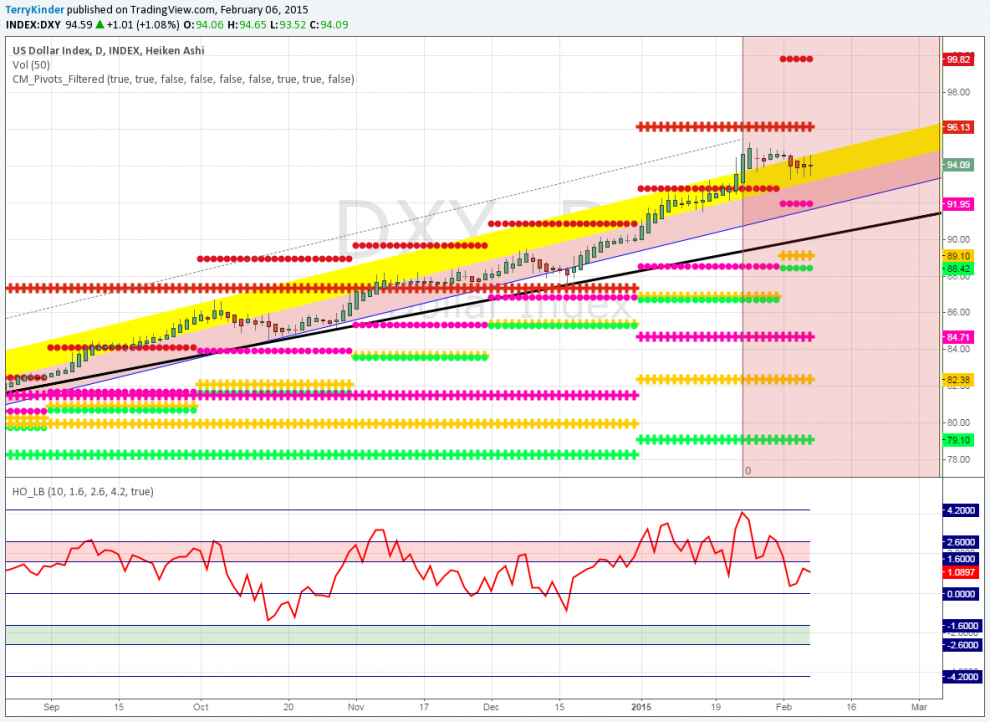
The dollar has cleared most of the monthly and yearly pivots.
Our final dollar chart shows the monthly and yearly price pivots.

Up, up and away for the U.S. Dollar? Image: pixabay
At the bottom of the dollar chart, the Hurst Oscillator indicates a slight weakening of price on this daily chart. Price moved below the pink shaded overbought band. However, as you can also see, the price hasn’t reached the green shaded oversold band within the time frame of this chart at all, so we shouldn’t expect the price to weaken substantially.
Overall, the dollar price and technical indicators look a bit stretched. However, betting against the strong uptrend could be hazardous to your finances. As our review of the dollar charts shows, price has only recently broken out. Until the dollar clearly breaks lower expect it to continue its upward momentum.
Bullion.Directory or anyone involved with Bullion.Directory will not accept any liability for loss or damage as a result of reliance on the information including data, quotes, charts and buy/sell signals contained within this website. Please be fully informed regarding the risks and costs associated with trading in precious metals. Bullion.Directory advises you to always consult with a qualified and registered specialist advisor before investing in precious metals.


Leave a Reply