With so much doom and gloom about the gold price, it appears to have caught at least a small bounce for now.
 Bullion.Directory precious metals analysis 16 March, 2015
By Terry Kinder
Investor, Technical Analyst
There have been a lot of negative articles about the gold price recently. It’s possible that, at least on a short-term basis, sentiment may have turned a little too negative. While not necessarily convinced this current bounce will be durable, let’s take a look at three charts that might provide some insight into why the gold price is bouncing at this particular moment in time.
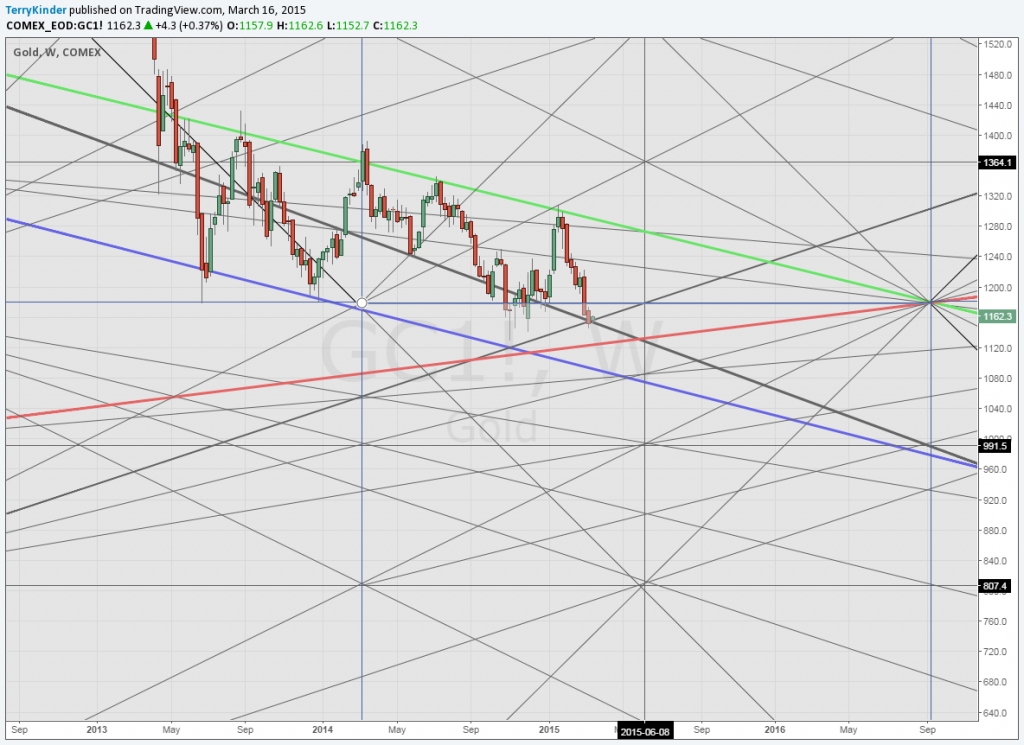
Gold’s Red Line
A few days ago, we discussed the red line for the gold price. However, there were several significant lines on the chart. Two of those lines, a thick bold black line, and a thinner bold black line, crossed on the chart and marked an important point where a move lower would have set up both a break in an important trend-line, and also the possibility of violating what was deemed a red line. So, what happened?
It turns out that the gold price managed to bounce, avoiding moving below the descending trend-line. While this doesn’t change the trend, it at least holds out some hope that gold catches a short-term bounce.
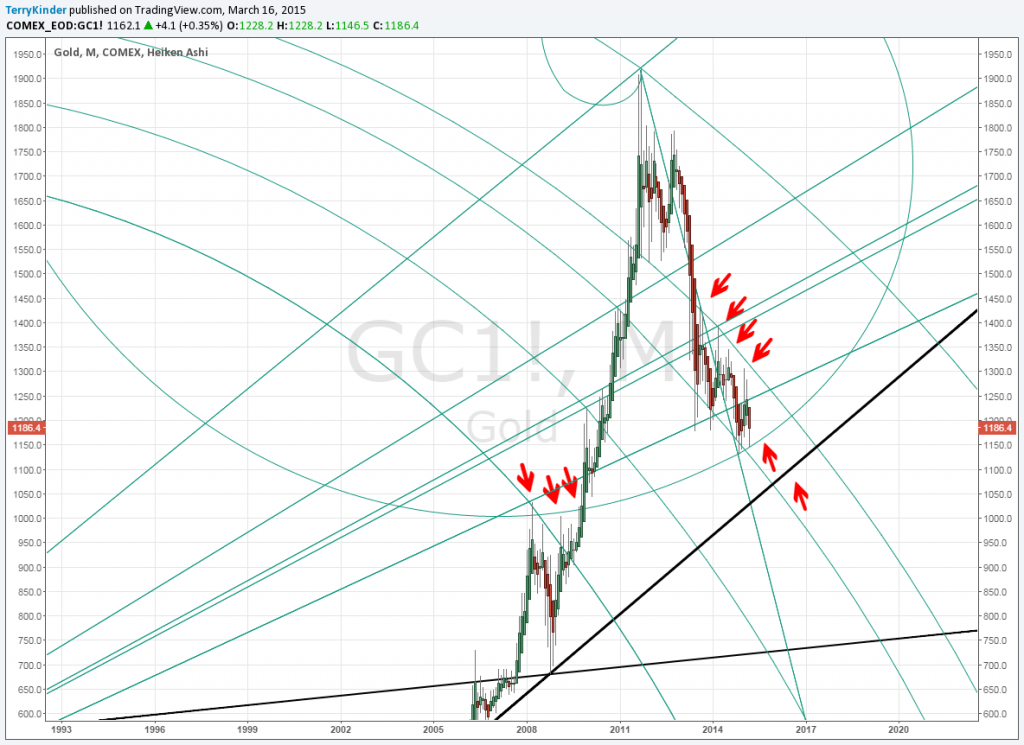
Gold Fib Spiral
Late last month we looked at a chart of Fib Spirals. Feel free to read the article for a little more explanation about Fibonacci Spirals. Quite interestingly, these spirals have the gold price caught in the middle between resistance and support.
As crazy as these Fib Spirals might appear at first glance, the have actually quite nicely bracketed the gold price. You may notice that the gold price has bounced twice off of the Fib Spiral near where an upward facing red arrow can be seen. Given the configuration of the spirals, it’s quite possible we will see price continue to oscillate up and down within what is essentially a declining arc.
If price were to break below the Fib Spiral where we have seen price bounce off of twice, then we face the possibility that the support line dating back to June of 2006 could be tested.
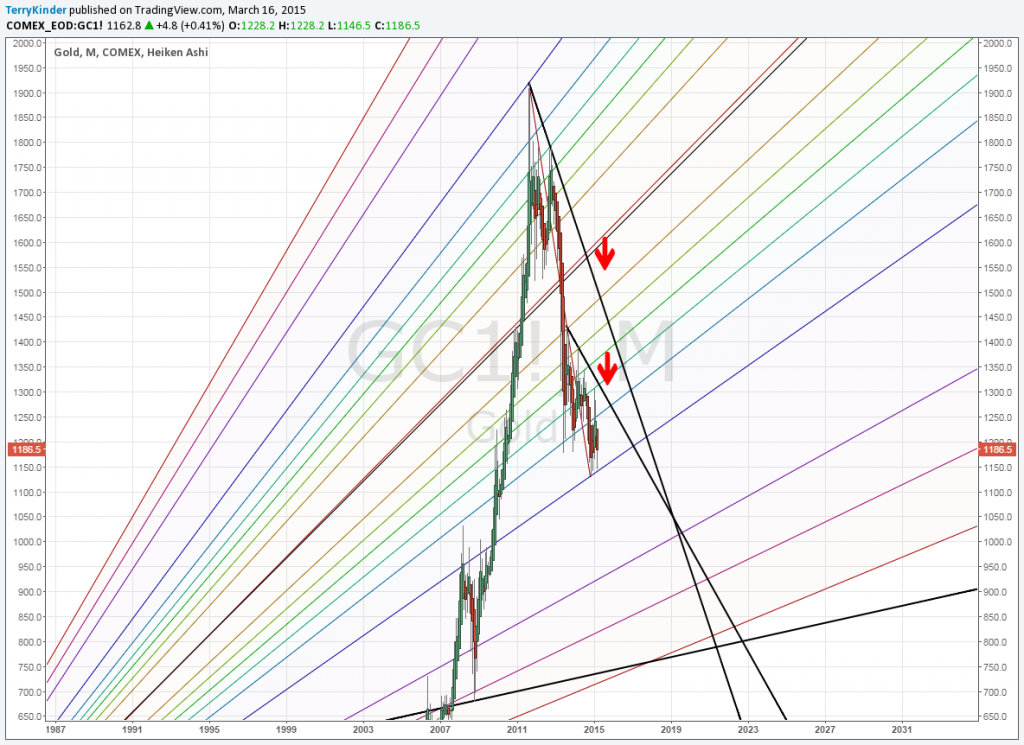
Gold Pitchfan
We recently re-drew our gold Pitchfan chart. The Pitchfan is a cross between a pitchfork and a Gann Fan. We decided to draw it again in order to better square time and price along a 45 degree angle. The result is below.
Not too surprisingly, the Pitchfan chart presents a very similar picture to that presented by the Fib Spirals. The gold price has managed to find support near an ascending Pitchfan support level (blue line). At the same time, price has been unable to break above the two resistance lines pointed to by the red arrows. Until price is able to break above those resistance lines, the long-term picture in the gold price remains down.
Conclusion
Short-term we could witness a bounce in the gold price.
However, it remains to be seen whether this temporary bounce will translate into anything more durable. While the recovery of the gold price above $1,157.00 offers some reason for optimism, it’s still a good ways from the $1,208.00 level that marked a more significant decline in the gold price and now transformed into price resistance.
Bullion.Directory or anyone involved with Bullion.Directory will not accept any liability for loss or damage as a result of reliance on the information including data, quotes, charts and buy/sell signals contained within this website. Please be fully informed regarding the risks and costs associated with trading in precious metals. Bullion.Directory advises you to always consult with a qualified and registered specialist advisor before investing in precious metals.


 Material provided on the Bullion.Directory website is strictly for informational purposes only. The content is developed from sources believed to be providing accurate information. No information on this website is intended as investment, tax or legal advice and must not be relied upon as such. Please consult legal or tax professionals for specific information regarding your individual situation. Precious metals carry risk and investors requiring advice should always consult a properly qualified advisor. Bullion.Directory, it's staff or affiliates do not accept any liability for loss, damages, or loss of profit resulting from readers investment decisions.
