We look at 3 GLD charts
 Bullion.Directory precious metals analysis 10 February, 2015
By Terry Kinder
Investor, Technical Analyst
GLD had a nice run to begin 2015 but has since faded. We’ll assess the current situation with GLD in three charts.
Caught in a downward price channel
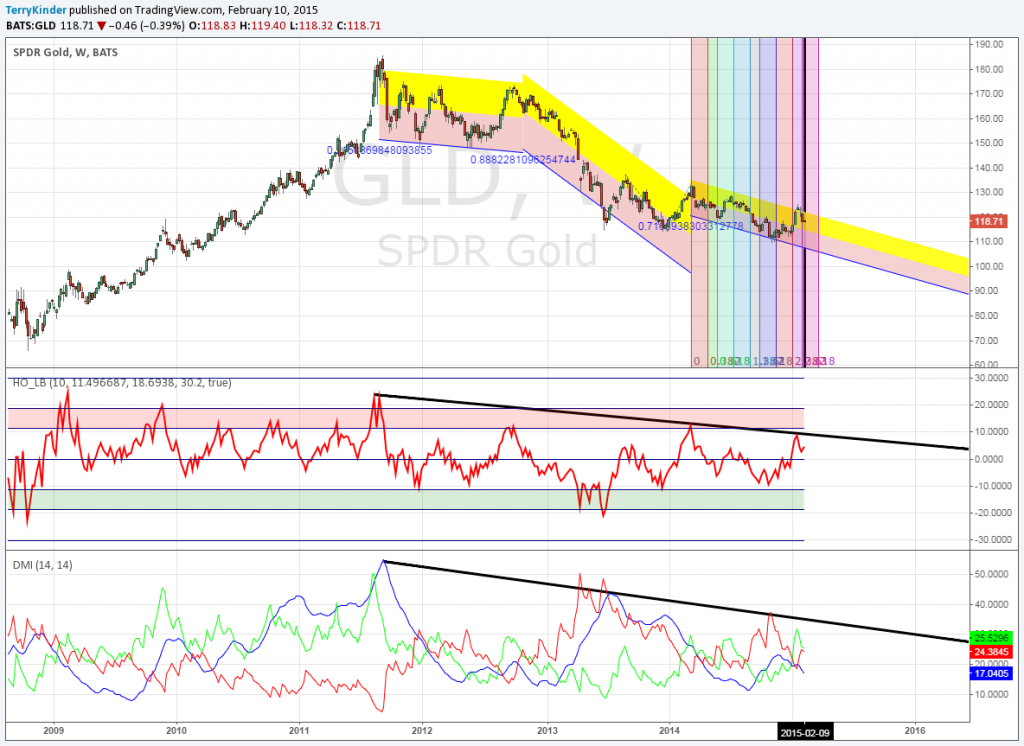
GLD, after having a nice run up from late 2013 to early 2014, has largely remained in a descending price channel, as can be seen in the chart below.
GLD is currently suffering from both a weakening in the Hurst Oscillator and the DMI. It hasn’t quite fallen off the wagon yet, but it has shown very weak upward momentum on the weekly chart as of late.
A pivot lower?
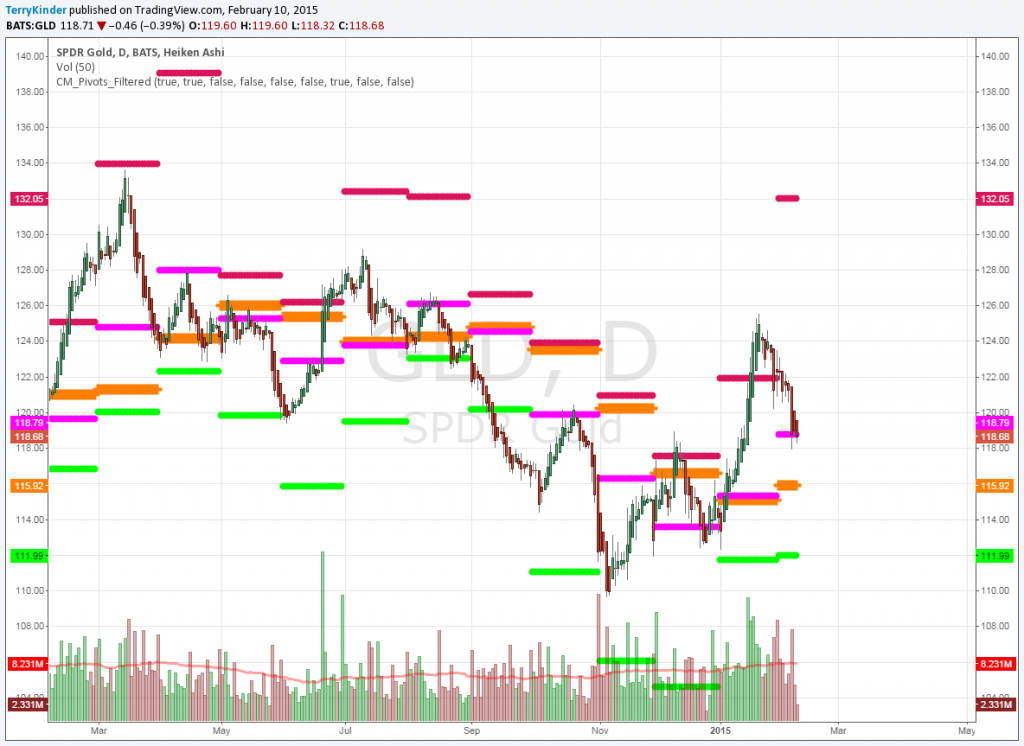
In the next chart, you can see that GLD has been sitting right around a pivot support level of $118.79. Should it be unable to hold that level, the next support level is $115.92.
More cloudy days ahead?
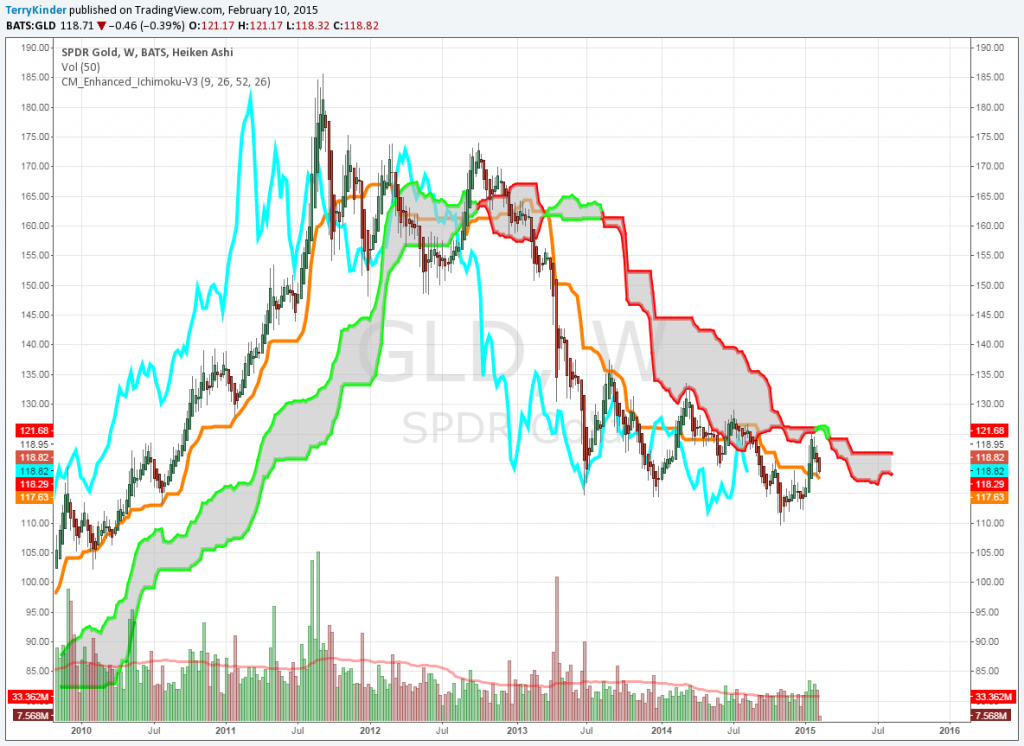
Our final chart is the weekly Ichimoku Cloud. While price briefly climbed above the orange line in a sign of strength, it has since declined and is threatening to cross back under it.
The blue lagging line remains under the orange line, another sign of price weakness. Price has remained capped by the red outlined cloud above it.
The downward price trajectory for GLD is little changed over the past two years or so.
It’s going to take something to change the downward momentum of the GLD price. Until it does, we should expect it to maintain the downtrend.
Bullion.Directory or anyone involved with Bullion.Directory will not accept any liability for loss or damage as a result of reliance on the information including data, quotes, charts and buy/sell signals contained within this website. Please be fully informed regarding the risks and costs associated with trading in precious metals. Bullion.Directory advises you to always consult with a qualified and registered specialist advisor before investing in precious metals.


 Material provided on the Bullion.Directory website is strictly for informational purposes only. The content is developed from sources believed to be providing accurate information. No information on this website is intended as investment, tax or legal advice and must not be relied upon as such. Please consult legal or tax professionals for specific information regarding your individual situation. Precious metals carry risk and investors requiring advice should always consult a properly qualified advisor. Bullion.Directory, it's staff or affiliates do not accept any liability for loss, damages, or loss of profit resulting from readers investment decisions.

Leave a Reply