

We take a look at the gold price through triangles and other unusual chart patterns
 Bullion.Directory precious metals analysis 25 February, 2015
By Terry Kinder
Investor, Technical Analyst
I’ve been wondering for the past thirty years or so when high school geometry and the Pythagorean Theorem were going to come in handy. Well, that day has finally arrived.
In case the theorem is a little fuzzy:
In mathematics, the Pythagorean theorem, also known as Pythagoras’s theorem, is a relation in Euclidean geometry among the three sides of a right triangle. It states that the square of the hypotenuse (the side opposite the right angle) is equal to the sum of the squares of the other two sides.

In the equations below c is the hypotenuse, a is horizontal and b is the vertical portion of the triangle.
a2 + b2 = c2
| _______ | |
| c = √ | a2 + b2 |
I’m not going to go into all of the details, but using the above information, you can deduce from a price chart approximately when high and low prices will be made. In the chart below the potential highs and lows are approximations. You should also consider this experimental and not base any trading on this.
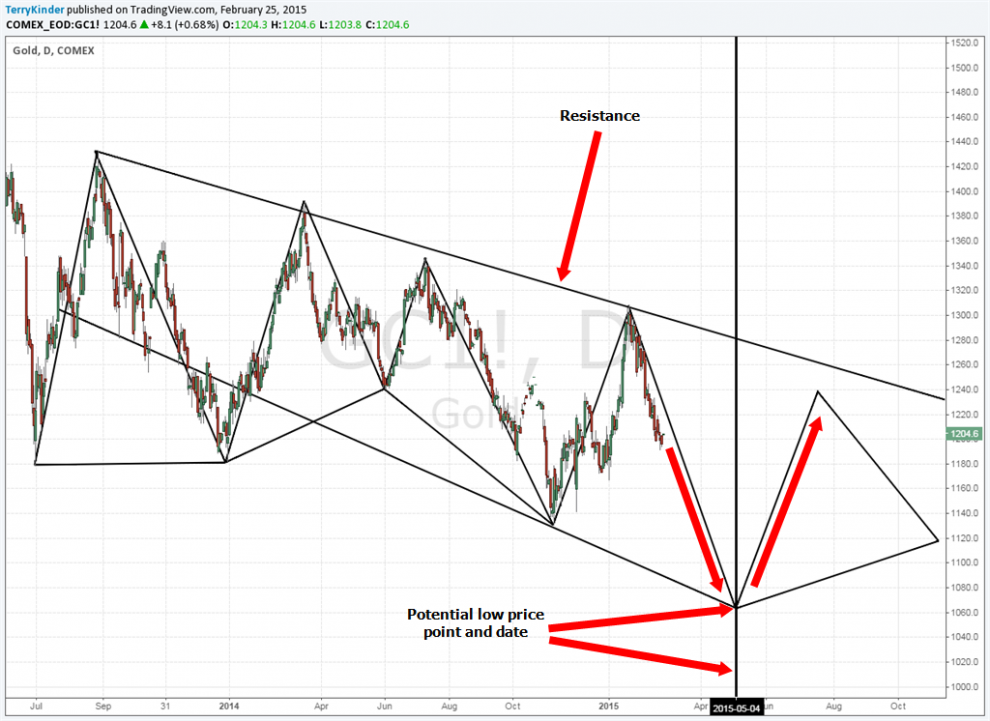
At last the Pythagorean Theorem came in handy
Now, one thing somebody surely will observe is that these triangles don’t appear to be right angle triangles. My reply is this:

Triangles and more triangles Image: morgueFile
1) For the purposes of this method I don’t believe that will significantly affect the effectiveness of the technique;
2) These triangles are actually the faces of a larger geometrical object (think Platonic solid) which, in turn, is within a larger object. Oh, and to make it more fun, that object is essentially tumbling. So the chart is a two dimensional representation of what is a four-dimensional object contained within a fifth-dimensional object. Again, in terms of our analysis here, those dimensions aren’t of critical importance, although being able to visualize them would greatly aid in making our analysis more accurate.
Currently the gold price is in the second to last triangle drawn on the chart. It appears that sometime near early May that price will bottom somewhere near $1,065.00. That level is not too far from one of the important support levels that we’ll look at in a moment on our pivot charts. As you can see looking at the other triangles, price can and does occasionally break above the triangle, but largely conforms to its shape.
Fib spirals
Well, in case the triangles weren’t enough for you, let’s take a look at some Fibonacci spirals. These spirals are drawn pivot highs to lows and from highs to lows on the chart. You can only really view one spiral more fully – the one based on the 2011 high price for gold. The other spirals look like partial circles, but are actually spirals.
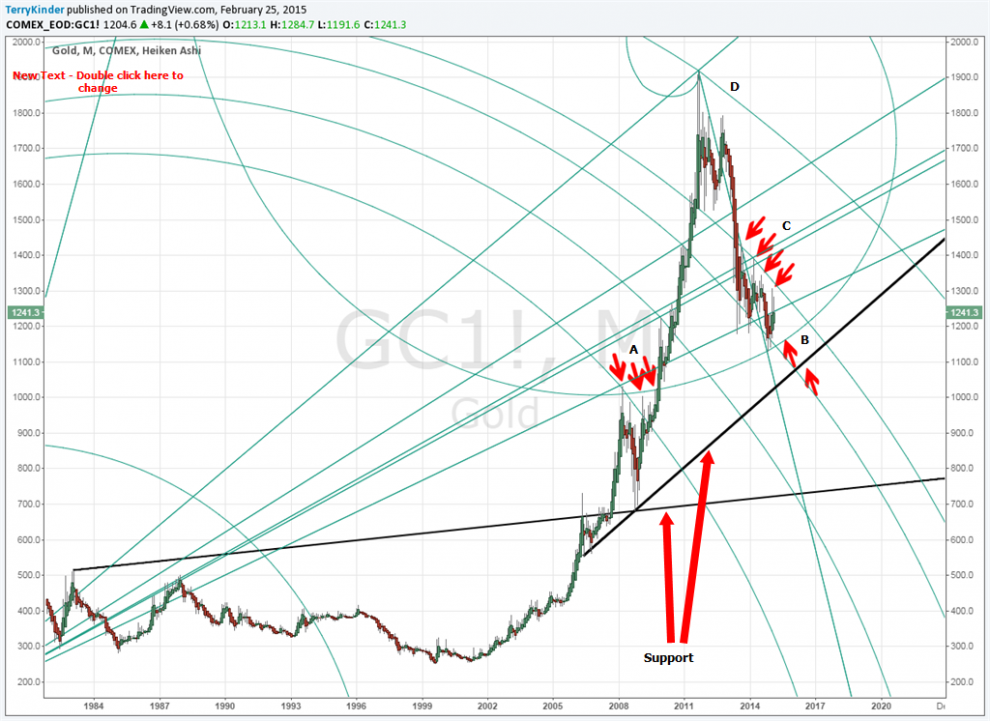
The Fib spirals provide clues to where the gold price may be headed
Important features of the chart are as follows:
1) Two support levels – If the first support level is broken, and price cannot break out of the current Fib spiral, then the second support level could come into play;
2) A Fib spiral can act as both support and resistance. Notice at A the spiral acted as resistance but, later, at B it offered support;
3) The gold price has been unable to break out of the spiral at C. Each time it has approached the spiral it has turned back lower;
4) B may either act as support again, providing an ascending level of support, or it will be violated setting up a test of the higher level support line;
5) When the gold price does eventually move higher, we should expect the Fib spiral at D to provide a high level of resistance. In fact, price crossing this spiral could eventually be one of the signs of the resumption of the gold bull. But, we could see the gold price move laterally across the spiral as the gold price did after the end of the previous bull market. The process could take a while, but will likely, after a period of time, result in a new nominal high for gold. This is not something we should necessarily expect soon.
Gold weekly and monthly pivots
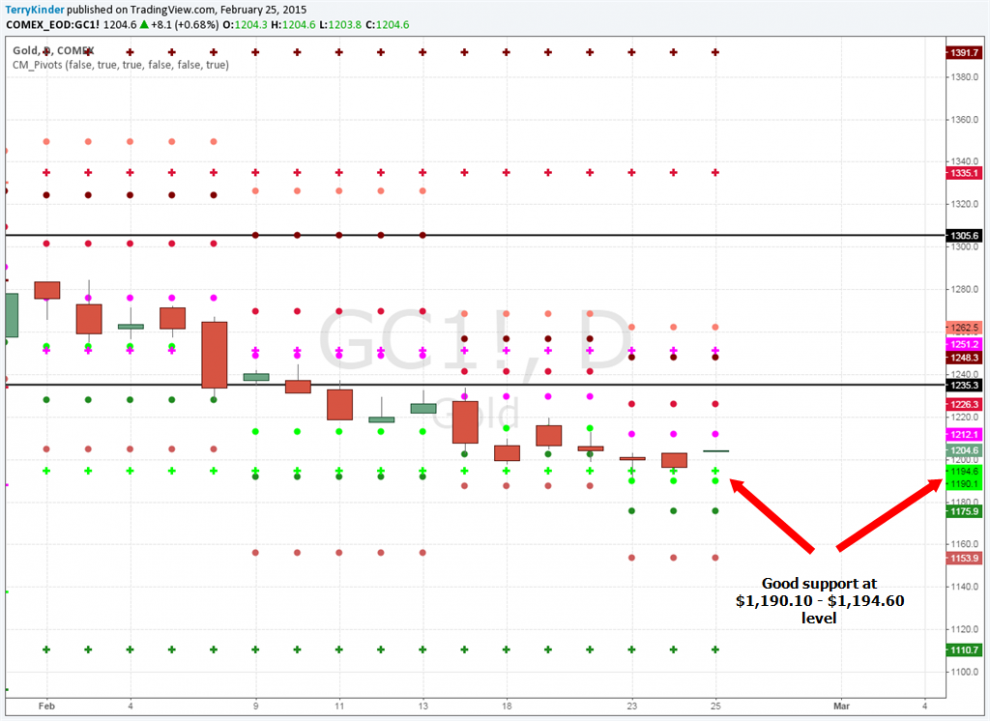
Gold, on this weekly and monthly pivot chart, has good support at the $1,190.10 – $1,194.60 level
The gold price is well-supported at the $1,190.10 – $1,194.60 level. There is also support at the $1,175.90 and $1,153.90 levels.
Gold yearly pivots
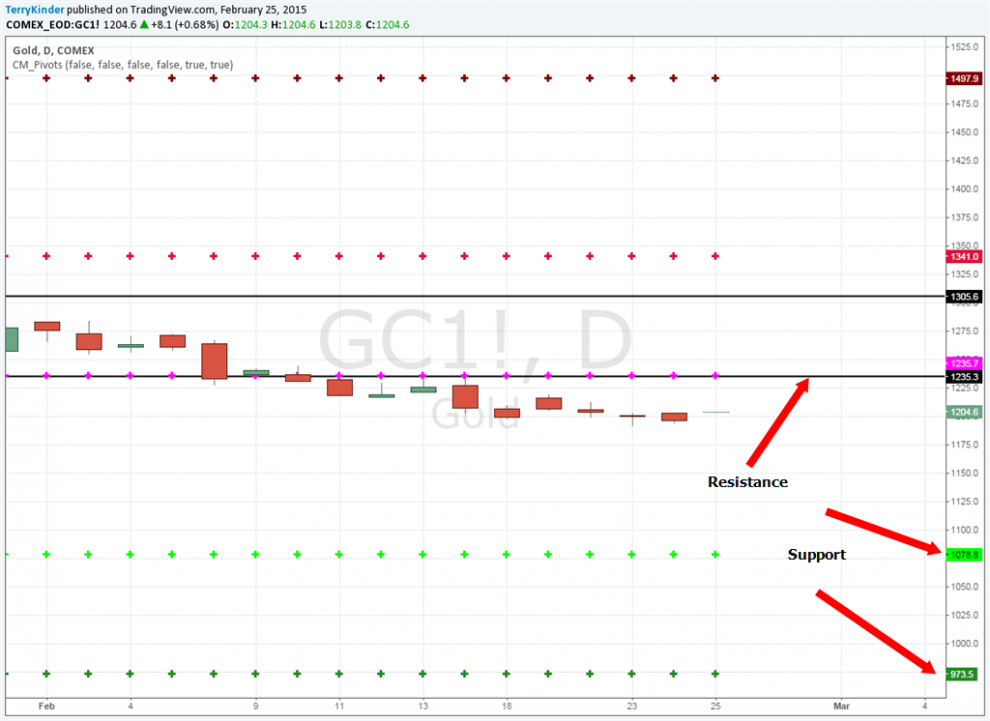
On the yearly chart there is support at $1,078.80 and $973.50
Yearly pivot support for gold is at $1,078.8 and $973.50. The $1,078.80 is relatively close to the approximately $1,065.00 level derived from looking at triangle patterns. So, it would not be out of the question for the gold price to move near the $1,065.00 – $1,078.00 level.
Whether through methods relying on the Pythagorean Theorem, Fib spirals, or pivot points, there are many ways to gain a better understanding of price direction. It doesn’t hurt to think in multiple dimensions either.
Bullion.Directory or anyone involved with Bullion.Directory will not accept any liability for loss or damage as a result of reliance on the information including data, quotes, charts and buy/sell signals contained within this website. Please be fully informed regarding the risks and costs associated with trading in precious metals. Bullion.Directory advises you to always consult with a qualified and registered specialist advisor before investing in precious metals.


Leave a Reply