

The gold price has recently found Fibonacci Spiral support
 Bullion.Directory precious metals analysis 3 April, 2015
By Terry Kinder
Investor, Technical Analyst
The gold price, despite fears it might re-test the $1,130.40 low, has managed to find support from two Fibonacci Spirals – one based on the $1,920.80 all-time high price, and the other based on the more recent November, 2014 low of $1,130.40.
Close Up View of Gold Fibonacci Spiral Support
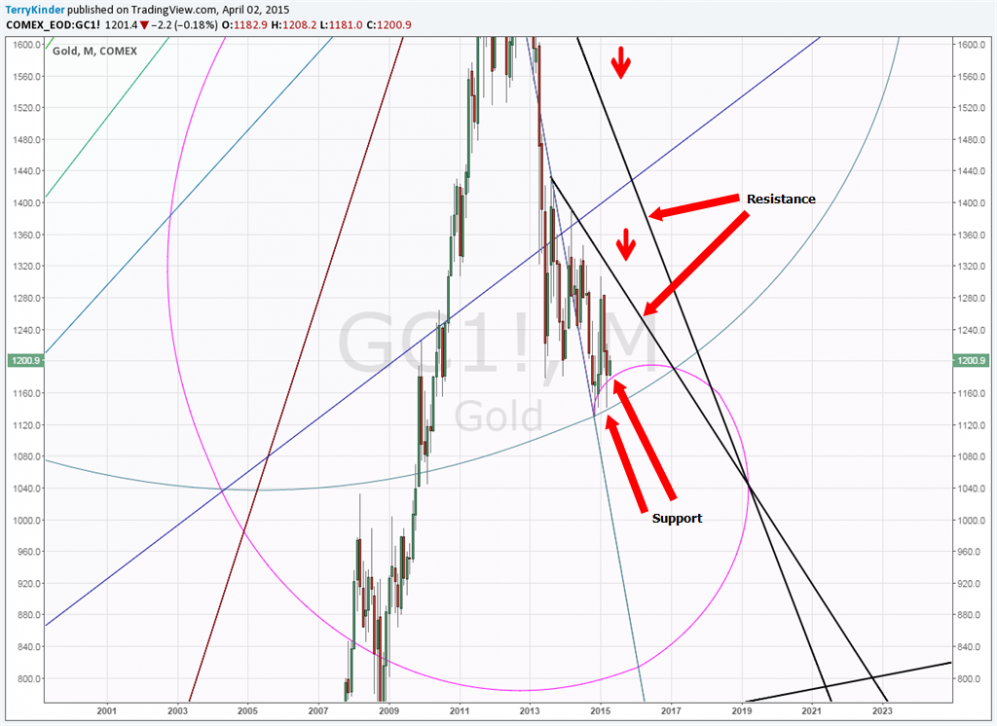
The gold price has found support near two separate Fibonacci Spirals
The gold price is supported by two Fibonacci Spirals. One is based on the $1,130.40 low from November of 2014. The other is based upon the all-time high of $1,920.80 from 2011.

Thus far Fibonacci Spiral support has held. It will be worth watching how this support level holds as it will determine the future direction of the gold price.
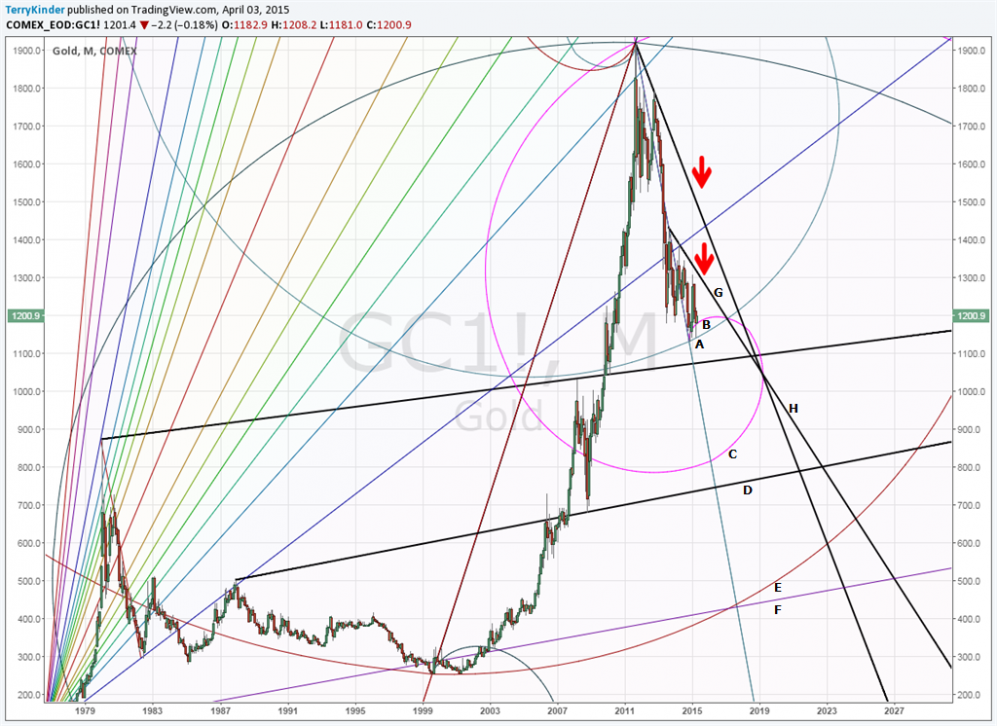
Gold is supported at A, B, C, D, E, and F. There is resistance at G and H.
Notable features of the above chart are:
- A – Fibonacci Spiral support based on 2011 all-time nominal high gold price of $1,920.80. Also, directly below A is a price support line dating back to the 1980 price high of $873.00;
- B – Fibonacci Spiral support based on November 2014 low price of $1,130.40;
- C – Another portion of the same Fibonacci Spiral highlighted in B;
- D – Another support line – The October 2008 low of $681.00 touched this line;
- E – Another Fibonacci Spiral support level;
- F – Pitchfan (combination pitchfork / Gann Fan) support level;
- G – Price resistance line;
- H – Price resistance line
Note: G should have been placed to the right of the line drawn downward from the all-time gold high of $1,920.80.
For an even longer-term perspective on the gold price see “Gold: Phi Circles and Fibonacci Spirals“.
Conclusion
The gold price has continued to be supported by Fibonacci Spirals based on the $1,920.80 all-time high price and the more recent $1,130.40 low.
So long as the gold price maintains support highlighted at point A on the second chart, price will follow a generally upward path, leading to higher prices. Should price drop below Fibonacci Spiral support on a monthly basis then we would have to look at other support levels – primarily the upward sloping support line drawn from the 1980 price high.
Bullion.Directory or anyone involved with Bullion.Directory will not accept any liability for loss or damage as a result of reliance on the information including data, quotes, charts and buy/sell signals contained within this website. Please be fully informed regarding the risks and costs associated with trading in precious metals. Bullion.Directory advises you to always consult with a qualified and registered specialist advisor before investing in precious metals.


Leave a Reply