

The recent bounce up in the US Dollar bull has some wondering whether or not the dollar is merely pausing before it runs even higher in price.
 Bullion.Directory precious metals analysis 15 October, 2014
By Terry Kinder
Investor, Technical Analyst
Nobody wants to be on the wrong side of the US Dollar bull.

US Dollar Bull: Don’t get on the wrong side of a bull.
Image: morgueFile
Judging by the daily DXY, the US Dollar bull has lost a little momentum. The dollar price briefly rose above the price trigger line labeled A, but then fell back below it which can be seen as sign of weakness.
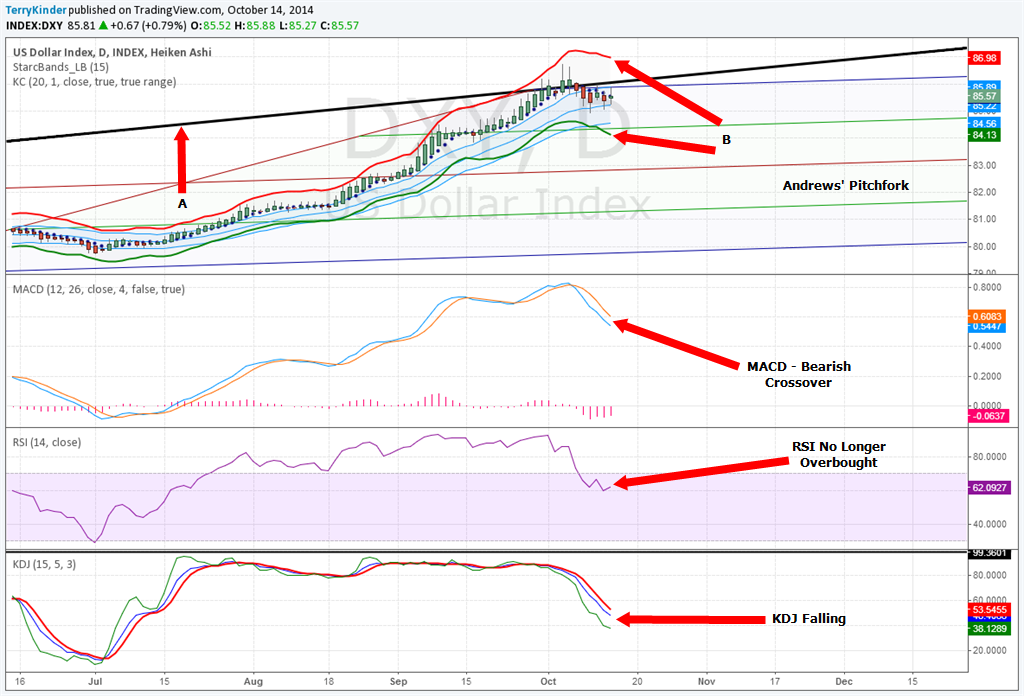
US Dollar Bull: Looking at a daily chart of the DXY it appears that dollar momentum to the upside may be weakening somewhat.

This is another sign of downward price momentum. Confirming dollar weakness is the bearish MACD crossover, declining RSI, and the falling KDJ.
On the weekly chart, the US Dollar bull looks stronger than it does on the daily chart.
The dollar price crossed a little above the price trigger line labeled A, but fell back beneath the line this week. Meanwhile, MACD labeled C remains at a very high level. However, RSI labeled D and KDJ labeled E are falling.
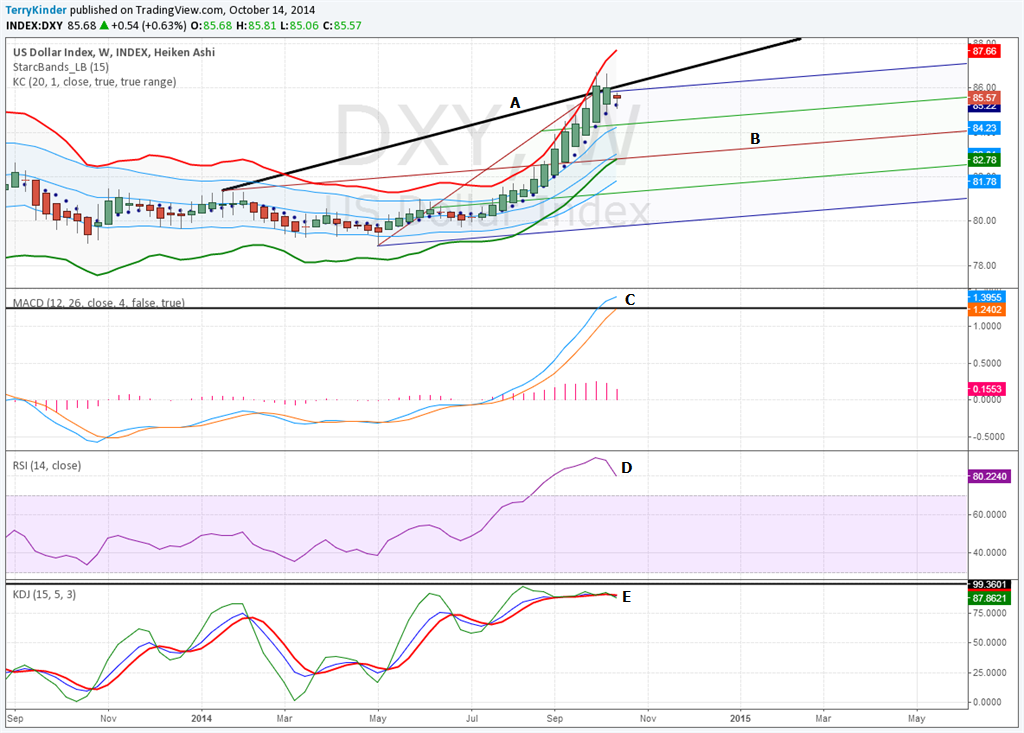
US Dollar Bull: On the weekly chart the dollar looks a little stronger than it does on the daily chart.
The monthly dollar chart has quite a bit going on so we will break it down into bullet points to make it as easy to follow as possible.
- A – US Dollar price peak at over $160.00. This corresponds to the peak in RSI right around 1985;
- B – Bottom in the dollar price which corresponds to a low in the RSI;
- C – Another peak in the dollar price corresponding to an elevated RSI level;
- D – A low point in the dollar price matching another low in the RSI;
- E – Price resistance line dating back to around 1985;
- F – Price resistance level at $86.84;
- G – Price trigger line based on smaller Andrews’ Pitchfork;
- H – MACD bullish crossover;
- I – Overbought RSI;
- J – Large descending triangle (black lines);
- K – Small triangle outlined in red;
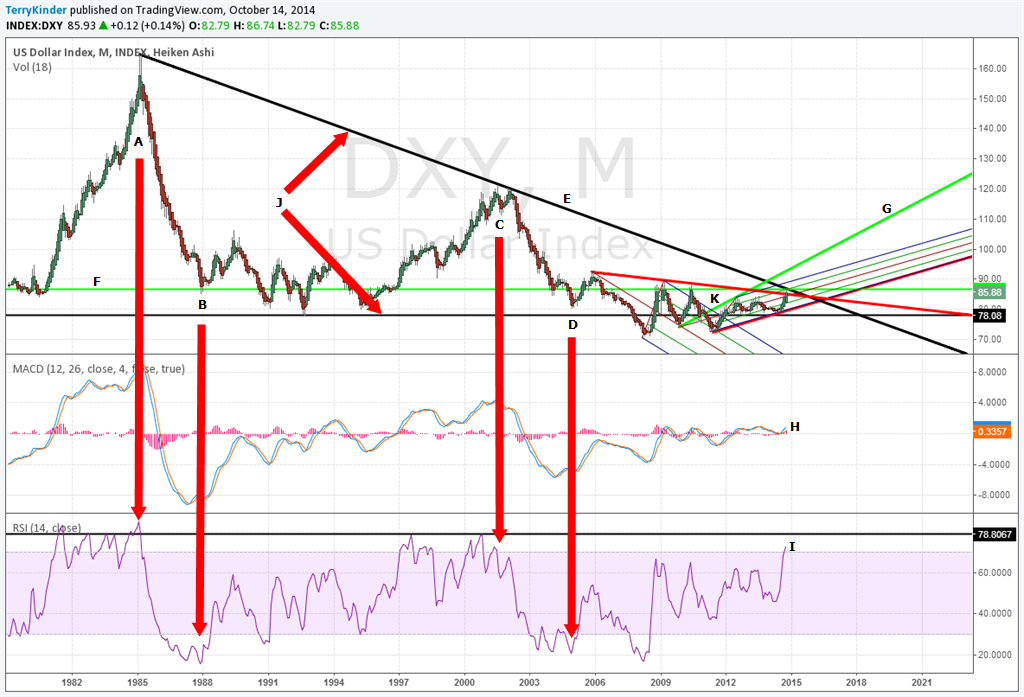
US Dollar Bull: The monthly is the most complex and interesting chart out of the charts we have seen so far.
- RSI is at a very high level. This could last a while. However, note that high prices coupled with high RSI levels at A and C were followed by low prices and lower RSI levels at B and D respectively;
- The two triangles J and K are worth keeping an eye on. The triangle labeled J is a multi-decade descending triangle. Given the overall downward trend of the dollar, it is a reasonable assumption that the price will fall down and out of the big triangle ending the US Dollar bull in the not too distant future. Logically that means the dollar price will first fall out of the smaller red triangle. That too seems logical since the dollar price breaking to the upside out of the red triangle would also mean price would likely have to take out the almost 30-year price resistance line labeled E;
Conclusion:
The US Dollar bull is at a critical point in the cycle. We should know fairly soon whether the dollar will break through the almost 30-year price resistance line or not.
Keep an eye on the daily, weekly and monthly US Dollar charts. Their price action over the next days, weeks, and months will determine whether the US Dollar bull continues and will also strongly influence stock prices as well as precious metals.
Bullion.Directory or anyone involved with Bullion.Directory will not accept any liability for loss or damage as a result of reliance on the information including data, quotes, charts and buy/sell signals contained within this website. Please be fully informed regarding the risks and costs associated with trading in precious metals. Bullion.Directory advises you to always consult with a qualified and registered specialist advisor before investing in precious metals prices.


Leave a Reply