Speculative trading in gold added $1 per tonne during the bull market. What gives…?
 Bullion.Directory precious metals analysis 31 May, 2016
By Adrian Ash
Head of Research at Bullion Vault
Or so anyone trading and watching Comex futures contracts seems to think…rather than tracking the price of gold bullion itself.
Yes, May saw a bad run of daily drops in US Dollar prices, but not as bad as silver did. It also saw extreme swings in gold prices. But simply picking the high and the low overstates the volatility in physical gold trading.
Because the central physical trading hub of London was closed for spring holidays both at the month’s high and then at its low. And thin trading allows sharper spikes.
While London was closed for the May Bank Holiday, gold started the month with a 15-month high of $1305 per ounce. It ends the month after another UK holiday saw a 3-month low just beneath $1200 this Monday.
Top-to-bottom the benchmark price for gold bullion in London ranged 7% in May…not the 8% shown by watching the front-month US futures contract. And what’s more telling, if not important, is that on a monthly average basis gold actually rose, extending its recovery from December’s new 6-year low to add another 1.4% and reach the highest monthly average since August 2014 even against the rising US Dollar.
Fundamentally it’s easy to blame the Fed’s latest rate-hike promises for end-May’s 7% drop from end-April. But after the price jump and new investing surge of 2016, profit-taking looks the bigger culprit. And fair’s fair – that profit-taking has most clearly hit speculative trading in US Comex futures and options.
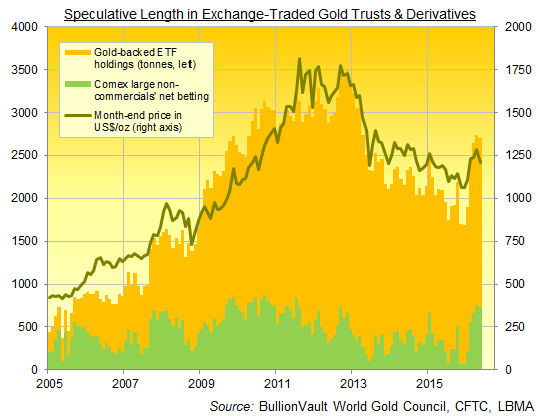
Exchange-traded trust fund holdings have now flat-lined for a week and more. But large speculative traders in Comex futures and options have meantime slashed their net bullish betting by more than one-fifth from mid-May’s new all-time record.

But what is truly remarkable about gold trading so far in 2016 is how little the price in fact gained as ETF and Comex bulls piled in like never before.
Sure, the first 3 months of 2016 saw gold priced in Dollars rise at the fastest pace in almost three decades. But here at end-May, ETF and Comex gold traders have added well over 1,000 tonnes of speculative length between them since New Year.
Yet that has seen the price rise only $150 per ounce…a paltry 14 cents per tonne.
Compare and contrast a price-rise nearer $1 per tonne of speculative length throughout the financial crisis peaking August 2011, with gold adding $375 per ounce on 225 tonnes of extra speculation over the 5 months ending that summer.
So the source of this 2016 drag so far? Gold miner hedging maybe. It began creeping back as prices rose in early 2016 after the industry missed the top, having got burnt needing to chase gold higher to close out the hedges it bought a decade earlier to lock in the lowest prices for 20 years at the end of gold’s previous bear market, ending 2001.
Or perhaps Asian physical demand is dragging on gold prices. Now almost entirely absent, thanks both to local factors (such as over-stocking in China and India’s jewelry industry battling the government over new sales taxes) as much as to rising prices, it was heavier than ever on the 2013 price crash, which would perhaps have been much worse without Indian and Chinese households buying the slump.
Still, the appetite for fresh betting against the Fed, in favour of gold, is clear. All the hot money needs now, no doubt, is another peak and trough in Fed expectations going into the June meeting.
Bullion.Directory or anyone involved with Bullion.Directory will not accept any liability for loss or damage as a result of reliance on the information including data, quotes, charts and buy/sell signals contained within this website. Please be fully informed regarding the risks and costs associated with trading in precious metals. Bullion.Directory advises you to always consult with a qualified and registered specialist advisor before investing in precious metals.


 Material provided on the Bullion.Directory website is strictly for informational purposes only. The content is developed from sources believed to be providing accurate information. No information on this website is intended as investment, tax or legal advice and must not be relied upon as such. Please consult legal or tax professionals for specific information regarding your individual situation. Precious metals carry risk and investors requiring advice should always consult a properly qualified advisor. Bullion.Directory, it's staff or affiliates do not accept any liability for loss, damages, or loss of profit resulting from readers investment decisions.

Leave a Reply