Precious Metals Market Report
Friday 19 May, 2017
Fundamentals and News*
Gold Retreats as U.S. Manufacturing Gauge Climbs, Dollar Rallies
Gold’s Haven Status Refreshed as Trump’s Turmoil Wounds Stocks
Gold +2.1% this week at $1,253.75/oz Price touched $1,265.08/oz on Thursday, highest since May 1
A gauge of dollar +0.4% after six straight losses; U.S. equities advance
U.S. May Philadelphia Fed factory index 38.8 vs 22.0 prior
As of May 17, 2017, the price of gold has risen ~10% YTD (year-to-date). It has been very volatile lately. Gold touched a five-month high of $1,284 per ounce in April following President Trump’s comments on a strong US dollar and his preference for the Fed keeping interest rates low. It reached $1,220 per ounce on May 9, 2017, as uncertainty in France lessened with its election ending, and then rebounded 3% following media reports of Trump sharing classified information with Russian officials.
Gold needs to clear the $1,270 level before it can go higher to possibly reach $1,300, but for now, prices are a “little overdone” and a small correction is expected, according to Lan. “It all depends on the news flow.
Gold ended a six-day rally that was driven by a flight to quality amid disarray engulfing Donald Trump’s White House
Silver futures post 1st loss in 7 sessions
Platinum, palladium futures fall on Nymex
(*source Bloomberg)
Data – Forthcoming Release
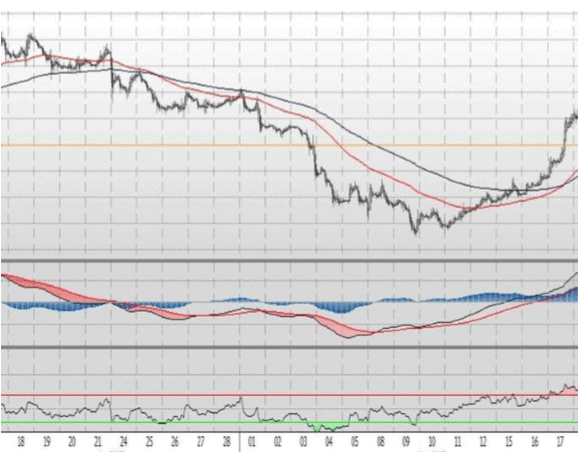
Technical Outlook and Commentary: Gold
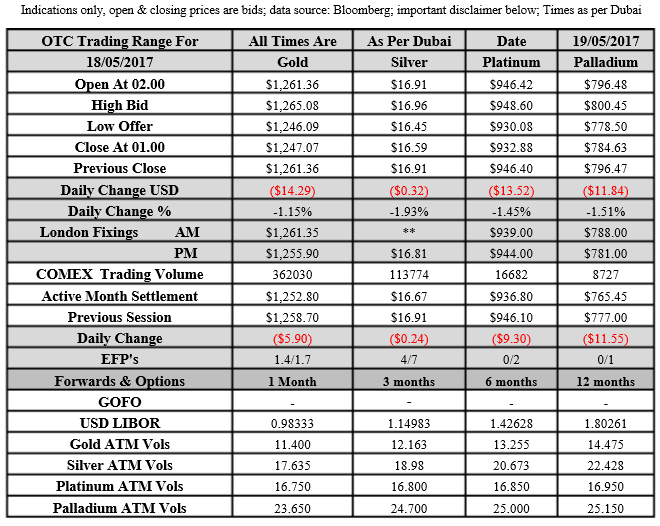
Gold for Spot delivery was closed at $1247.07 an ounce; with loss of $14.29 or -1.15 percent at 1.00 a.m. Dubai time closing, from its previous close of $1261.36
Spot Gold technically seems having resistance levels at $1261.1 and $1270.7 respectively, while the supports are seen at $1229.9 and $1220.3 respectively.

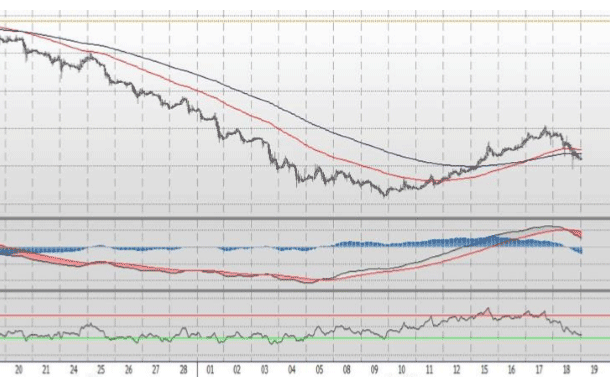
Technical Outlook and Commentary: Silver
Silver for Spot delivery was closed at $16.59 with loss of $0.32 or -1.93 percent at 1.00 a.m. Dubai time closing, from its previous close of $16.91
The Fibonacci levels on chart are showing resistance at $16.93 and $17.10 while the supports are seen at $16.37 and $ 16.20 respectively.

Resistance and Support Levels

Indications only, open & closing prices are bids; data source: Bloomberg; important disclaimer below; Times as per Dubai
Kaloti Precious Metals (KPM) does not provide trading or investment advice to its customers. The information provided in this report constitutes market commentary only and KPM assumes no liability whatsoever for the accuracy and/or any use of the information contained in this report and expresses no solicitation to buy or sell OTC products, futures, or options on futures contracts. The Customer should not regard any views or opinions given in this report as being investment or trading advice KPMI shall have no liability whatsoever for any view or opinion expressed in the report. Reproduction of this report without authorization is forbidden. All rights reserved.
Bullion.Directory or anyone involved with Bullion.Directory will not accept any liability for loss or damage as a result of reliance on the information including data, quotes, charts and buy/sell signals contained within this website. Please be fully informed regarding the risks and costs associated with trading in precious metals. Bullion.Directory advises you to always consult with a qualified and registered specialist advisor before investing in precious metals.


 Material provided on the Bullion.Directory website is strictly for informational purposes only. The content is developed from sources believed to be providing accurate information. No information on this website is intended as investment, tax or legal advice and must not be relied upon as such. Please consult legal or tax professionals for specific information regarding your individual situation. Precious metals carry risk and investors requiring advice should always consult a properly qualified advisor. Bullion.Directory, it's staff or affiliates do not accept any liability for loss, damages, or loss of profit resulting from readers investment decisions.

Leave a Reply