

Gold Price Support Resistance Next Week (11-10-14)
 Bullion.Directory precious metals analysis 7 November, 2014
By Terry Kinder
Investor, Technical Analyst
Gold Price Support Resistance Next Week (11-10-14)

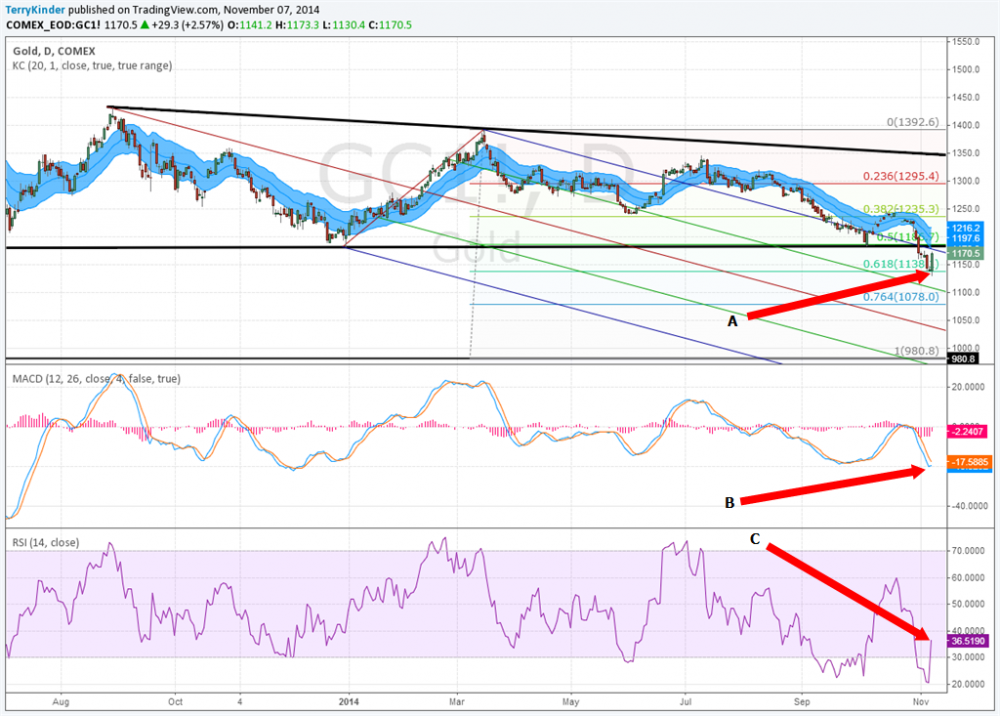
As you can see in the chart above, support at the Fibonacci level of 0.618 or $1,138.10 was briefly violated but held. There is overhead resistance at the 0.50 Fib level or $1,186.70.
Important chart features:
A. Price bounces off support at Fibonacci level 0.618 or $1,138.10;
B. MACD hooks back up. We’ll have to wait a bit more to see if it reverses upwards;
C. RSI moves out of oversold territory.
Gold Price Support Resistance Next Week – Other Important Levels
Support:
- $1,160.60 – $1,164.27
- $1,143.63 – $1,147.27
- $1,126.78 – $1,130.40
Resistance:
- $1,177.69 – $1,186.70
- $1,207.31 – $1212.26
- $1,242.31 – $1,247.33
If price can break above resistance at $1,186.70, that could prove important as it would represent price rising out of the descending Andrews’ Pitchfork. If price fails at the $1,186.70 level then $1,138.10 and $1,078.00 could come back into play.
Bullion.Directory or anyone involved with Bullion.Directory will not accept any liability for loss or damage as a result of reliance on the information including data, quotes, charts and buy/sell signals contained within this website. Please be fully informed regarding the risks and costs associated with trading in precious metals. Bullion.Directory advises you to always consult with a qualified and registered specialist advisor before investing in precious metals.


Leave a Reply