

Gold vs Cash vs Stocks: Estimated Buying Power After Inflation
Simply select a start year within the past 25 years and an investment sum to protect from inflation.
The calculator will estimate the current+ equivalent buying power of your initial chosen sum, contrasting money held as cash, as precious metals and having been invested in some popular blue-chip++ stocks.
Adjusted Buying Power
Under a Mattress $0
Gold $0
Silver $0
50:50 Gold/Silver $0
S&P 500 $0
Dow Jones $0
SVB Group $0
Precious Metals are Sold as Inflation Protection. But Do They Work?
![]() We always hear that gold and precious metals act as a form of inflation protection – another way of saying they will protect your future buying power – but do they actually work?
We always hear that gold and precious metals act as a form of inflation protection – another way of saying they will protect your future buying power – but do they actually work?
If there was no inflation, a dollar today would be worth a dollar in ten years time, but the reality of our financial system sees prices ‘increasing’ all the time. In other words, the value of the dollar in your pocket has eroded.
This becomes crystal clear as soon as you start playing with the above calculator: You’ll see that the money held ‘under a mattress’ loses it’s buying power the longer you hold it, and this is due to inflation.
To at least maintain your wealth at current levels your investments MUST be inflationary neutral, so that over time you maintain buying power. If they offer additional protection and increase your buying power then that’s TRUE profit.
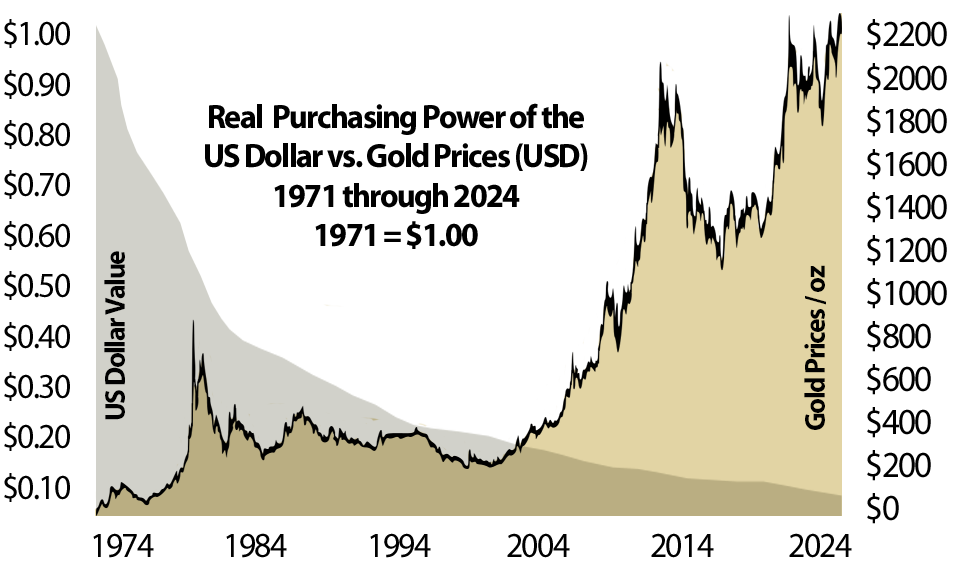
The graphical chart above shows exactly how badly the US dollar has lost its spending power, whilst gold has gained value over the same long-term period, in this case between 1971 and 2024.
This fact forms the crux of gold’s use as an anti-inflationary tool.
Gold and Silver in Practice
For gold and silver to act as true inflationary protection, they must raise buying power over time. Thankfully it doesn’t take long looking at the gold:dollar chart above, or trying various calculator results to see they do tend to do this most years.
Whether they improve your buying power more or less than stocks is another thing altogether – because as you’ll also notice when running through dates in the above calculator, is that there are times when stocks do better, worse or about the same.
This is why gold is also seen as such a good portfolio diversification tool, helping to balance your overall worth during times when stocks and other assets don’t perform.
And SVB Group? We added Silicon Valley Bank into the calculator as a jokey yet serious note that even the best and most trustworthy stocks, in the best and most beloved ‘too-big-to-fail’ companies, can and regularly do go to zero. Inflation is not your biggest concern when your valuation is zero or lower.
Which again helps illustrate gold’s use as a form of insurance. Gold’s intrinsic value and global desirability mean it will never ‘do’ a Silicon Valley Bank.
This calculator does not offer personalized financial advice and does not take into account your individual circumstances, financial situation, or specific investment objectives. Any decisions made based on the output of this calculator are taken at your own risk. Bullion.Directory is not responsible for any financial losses or gains incurred as a result of using this tool. We strongly recommend consulting with a qualified financial advisor before making any investment decisions. A professional can provide personalized advice and a comprehensive investment strategy that aligns with your goals and risk tolerance.
++ The selection of the S&P 500 and Dow Jones indexes in this calculator is based on their wide recognition and use as benchmarks in the financial industry. They are utilized here purely to demonstrate potential market performance over time and are not intended as investment suggestions or endorsements.
The inclusion of the SVB Group stock is intended to serve as a historical example of the risks inherent in investing in individual stocks. This highlights that stocks can, and sometimes do, lose their entire value, underlining the importance of due diligence and the need for investors to be aware of the risks associated with buying paper assets.
