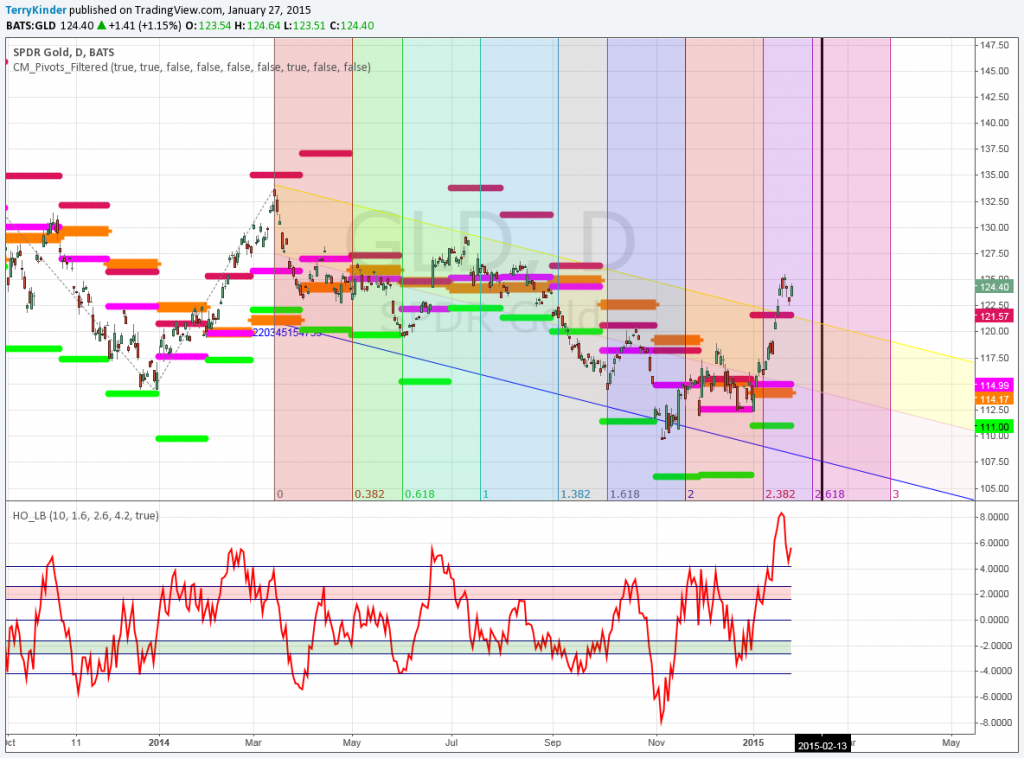
GLD will move from three standard deviations to two above a linear regression line by Friday the 13th
 Bullion.Directory precious metals analysis 28 January, 2015
By Terry Kinder
Investor, Technical Analyst
GLD is currently three standard deviations above its linear regression line in the chart below.

The GLD price is currently three standard deviations above its linear regression line.Image: Flickr
It would be easy to assume that with GLD being so far above its linear regression line, it would be a near certainty that it would fall back toward the channel it has been trading within soon. Well, it’s dangerous to make assumptions, so we won’t be making any here.
I’m not going to go into a long-winded explanation of the chart above except to say that it projects a trend forward in time using Fibonacci Numbers. I don’t want to generalize too much, but if you look at the shaded areas of the chart you’ll notice that prices tend to trend within each different colored area.
When combined with the monthly pivot points (they look like colored lines, but they are actually a series of circles), and the orange monthly pivot average, you can begin to get a sense when price could potentially change direction.
There are a couple of features on the chart worth noting:
1) The GLD price is currently above the highest monthly pivot. That indicates very strong price momentum. A strong uptrend like GLD is in could continue longer than you might think;2) The red and green shaded Hurst Oscillator indicates that GLD has reached an extreme overbought position. Again, just because GLD is extremely overbought doesn’t mean the price has to drop soon. Just consider the dollar and how it rose up in an almost straight line higher from May until this month (and it’s not certain it will stop rising, although you would think it might take a breather).
So, my thought is that the GLD price will back down a little bit. I’m not expecting this to happen immediately. That, in part, is why I’m thinking it may take the remainder of the current shaded area for it to fall back down toward the monthly pivot.
I’m not going to bore you with all the possible combinations of what could happen to the price and monthly pivots. You merely have to look to the left of the chart and see a lot of different things could happen that would negate the idea that the price of GLD will move lower.
A summary of reasons why I believe GLD will move lower:
1. GLD is three standard deviations above its linear regression line;
2. The Hurst Oscillator is extremely overbought. It could take a while for price to move down despite it being overbought. There is no guarantee that the GLD price won’t stay extremely overbought for some time to come, but I think it will begin to edge lower as GLD moves forward through its current shaded Fibonacci area;
3. I have a mystery and mirror opposite investment in mind should time and price meet where I expect them to, but you’re going to have to wait until Friday the 13th to see if the GLD price drops back into the descending price channel. The investment I have my eye on appears to be bottoming. One confirmation that it is indeed bottoming will be the price of GLD moving back down within the price channel.
Stay tuned to see if GLD deviation ends Friday the 13th and whether or not I make the mystery investment.
Bullion.Directory or anyone involved with Bullion.Directory will not accept any liability for loss or damage as a result of reliance on the information including data, quotes, charts and buy/sell signals contained within this website. Please be fully informed regarding the risks and costs associated with trading in precious metals. Bullion.Directory advises you to always consult with a qualified and registered specialist advisor before investing in precious metals.


 Material provided on the Bullion.Directory website is strictly for informational purposes only. The content is developed from sources believed to be providing accurate information. No information on this website is intended as investment, tax or legal advice and must not be relied upon as such. Please consult legal or tax professionals for specific information regarding your individual situation. Precious metals carry risk and investors requiring advice should always consult a properly qualified advisor. Bullion.Directory, it's staff or affiliates do not accept any liability for loss, damages, or loss of profit resulting from readers investment decisions.
