

Oil: Ignore directional bias at your own peril
 Bullion.Directory precious metals analysis 11 February, 2015
By Terry Kinder
Investor, Technical Analyst
Andreas Clenow just don’t like technical analysis, or at least the fringe kind.
The next step is the outright lunacy. The world of utter fantasy. You might want to drop some acid before going down this route to help the suspension of belief.
You see, there are these magical numbers that govern the fate of the universe, which control everything in the world, from the formation of galaxies to the horns of goats to the behavior pattern of humans and by dividing these magical numbers found by a genius Italian rabbit counting mathematician named Leonardo a few hundred years ago you get equally magical ratios which you can use to predict stock price moves to the exact decimal and make tons of money, if you just buy the right books and courses first.Are technical analysts just howling at the moon? Image: pixabay

When I glanced up from my crystal ball and read the above, I fell of my stool, dropping my magic wand into my vat of newt eyes.

But, seriously, I can understand some of the criticism of technical analysis. It isn’t hard to find misapplications of technical analysis. Give me about 10 minutes and I’m pretty sure I could find 2-5 very salient examples.
On the flip side you have technical analysts who argue that technical analysis stands on its own. Jeremy du Plessis, author of The Definitive Guide to Point and Figure, argues (and I’m paraphrasing) that you don’t need fundamental analysis if you’re using technical analysis. He, and many others, put forward the idea that the information brought forth through fundamental analysis is already embedded in the price. Furthermore, du Plessis believes that fundamental analysis is often too late to the party and thus of little use to making decisions to buy or sell.
I’m sure many would vehemently dispute du Plessis’ point of view. Personally, I agree with much of what he says. At the same time, I also understand Clenow’s point about some of the fringe elements of technical analysis. I have encountered some of the “moon traders” and found their methods to be wanting.
Perhaps some technical analysts see Fibonacci numbers behind every tree. However, I do think that technical tools based on the work of W.D. Gann, Fibonacci, Alan Andrews, and others work, primarily, because they follow certain underlying mathematical principles. The fault is often in misapplying the tools. If you ignore important pivot points, use tools hoping to prove what you already believe to be true, or simply don’t take the time to check your work, you’re going to get inferior results.
Which, brings us round to crude oil – specifically West Texas Intermediate (WTI) prices. There is currently an interesting dichotomy amongst analysts studying the oil price. Some argue that oil production is far exceeding demand and, therefore, the price must come down to perhaps $40.00 or even $30.00 to $35.00 per barrel.
Others, myself included, think that oil may be at or near a bottom, although certainly that won’t be something we can know until some date in the future. Neither position is necessarily unreasonable, but more likely than not, only one position will be closer factually than the other. The question is, which one?
My purpose here is to restate some of my arguments for why I currently view the idea that oil is at or near a bottom is the highest probability outcome. Additionally, near the end, I will look at an additional tool provided by Mr. Clenow that I think will strengthen the argument for a bottoming oil price. Mr. Clenow’s tool is something that both technical and fundamental analysts should be using it because, as he says,
The shape of the term structures can indicate a directional bias. Ignore it at your own peril.
But, more about that later.
The oil price is finding support
It’s pretty easy to construct a disingenuous argument against this first point. I have seen some argue that since the oil price has declined, while others said it would find support, this means any current evidence of price support is invalid. Unfortunately, this disingenuous argument ignores a few things:
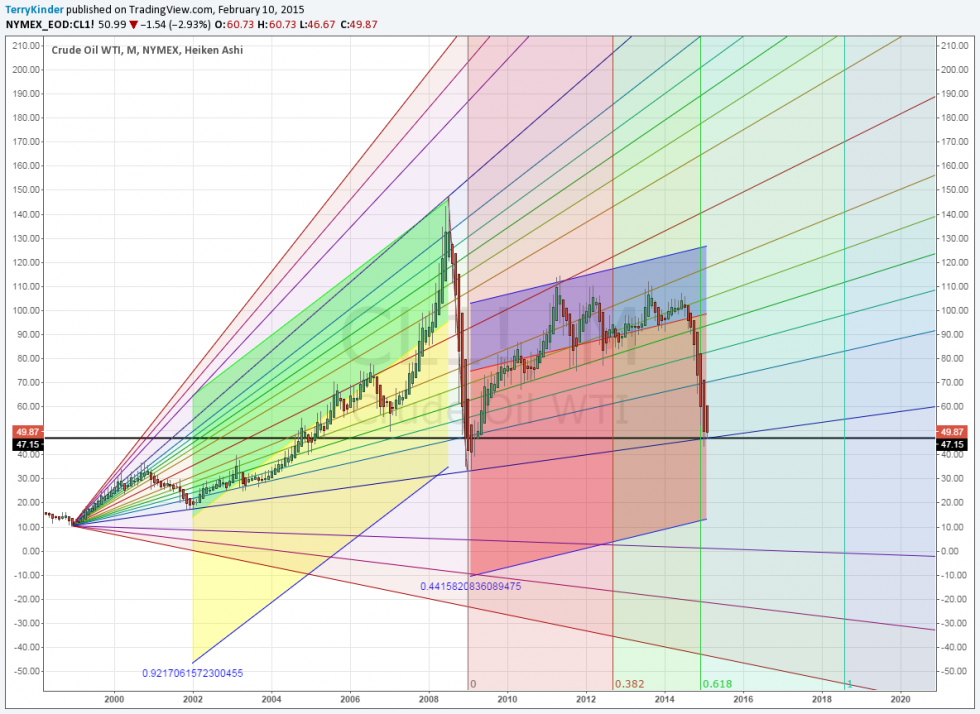
A) Support levels aren’t as simple as drawing a line on a chart or assuming that oil has to fall to the thirty dollar range just because it did six years ago. That doesn’t mean it can’t happen. However, I think this could be a case where the simplest construction isn’t necessarily the best.
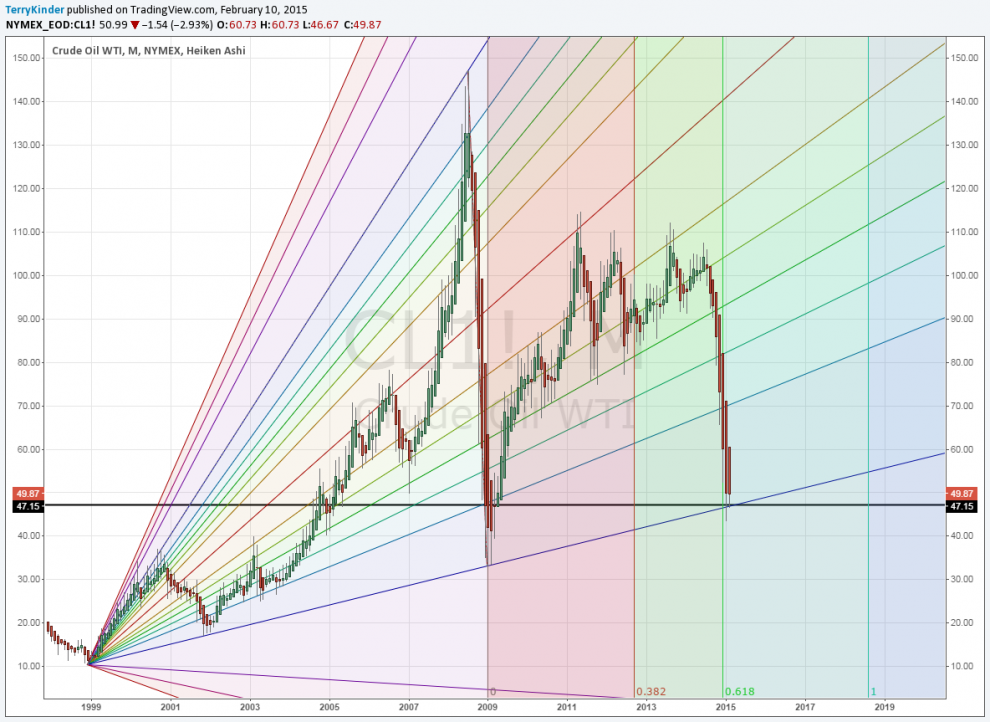
The oil price has found support multiple times on the blue line.
In the chart above we have used a Pitchfan – a combination of a pitchfork and Gann Fan. You may notice that price has found support several times over the years at the support level represented by the blue line. We could look at that fact in at least two different ways. First, it’s a good support level, and the price could continue to find support there. Second, price keeps testing the level and , eventually, could break below support. Certainly, either view could be argued reasonably. Given that, let’s take a look at another form of support we outlined in Oil Priced in Gold May be Near Bottom.
B) When the oil price approaches 1 gold gram per barrel, it tends to rebound higher.
We discussed this in some detail:
So, back to the oil price. One very good source of information for prices in terms of gold is Priced in Gold. Some of the information below is based on their oil charts.
If we measure WTI crude in gold grams rather than dollars we get an interesting result. Since 1950, when the price of West Texas Intermediate (WTI) crude oil falls to near 1 gram of gold (priced in dollars) per barrel, it typically means that the price is near a bottom. The only exception to this was a brief period in the 1970′s.
So, how much is the price of gold per gram? Currently it is approximately $39.92 per gram. On 29 January 2015 the price of oil fell to $43.58 and then bounced higher. So, on that date, a barrel oil came to within 8.398% of its price being equivalent to a gram of gold.
For the price of oil reasonably to fall further to $30.00 to $35.00 per barrel, one or the other of the following things has to happen:
1) The price of gold falls in dollar terms, making it possible that oil priced in gold grams can fall and still be at or above 1 gram of gold per barrel of oil, or;
2) The oil price has to fall below one gram of gold per barrel of oil – something it has only done once between 1950 and today.
C) Pivot price support levels are currently telling a similar story.
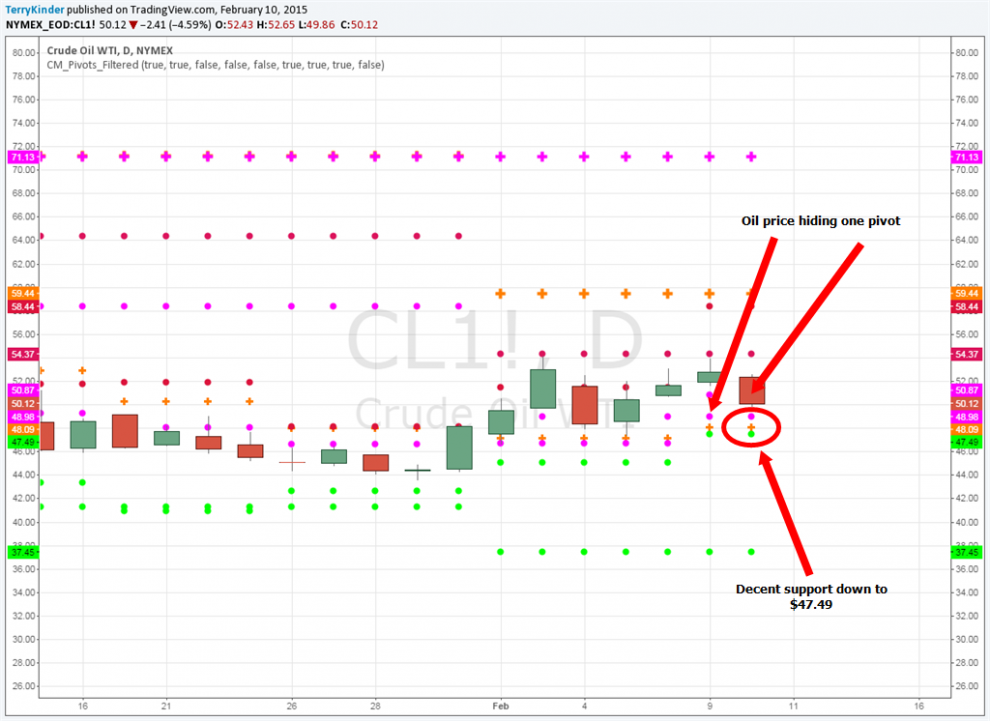
The oil price has decent support down to around the $47.49 level.
In the chart above, the oil price currently has decent support down to around $47.49. The price could probably slip below $47.00 and not break down. However, should that support give way, then the next pivot support level isn’t until $37.45.
WTI crosses
A) The oil price, on the Ichimoku Cloud chart below, managed to cross above the gold line, which is a sign of strength. However, it hasn’t yet broken above the downtrend line or the cloud outlined in red, so there is still work to be done to see a more sustained move up in price.
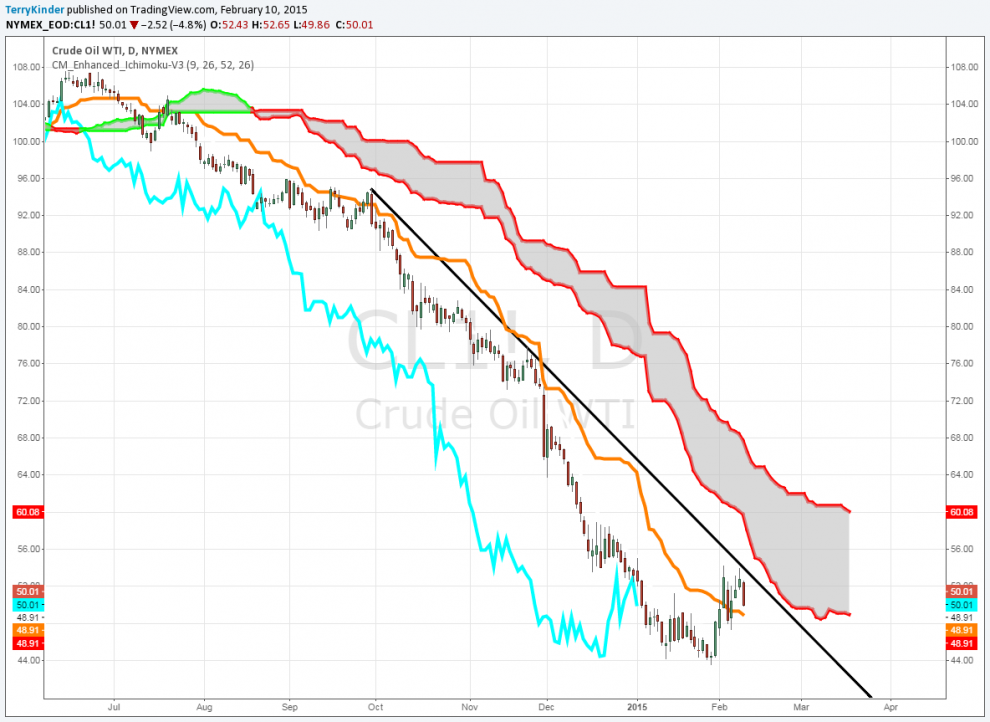
While the oil price demonstrated some strength crossing above the gold line, it still hasn’t broken above the downtrend line.
B) EMA 5-day crosses above 13-day
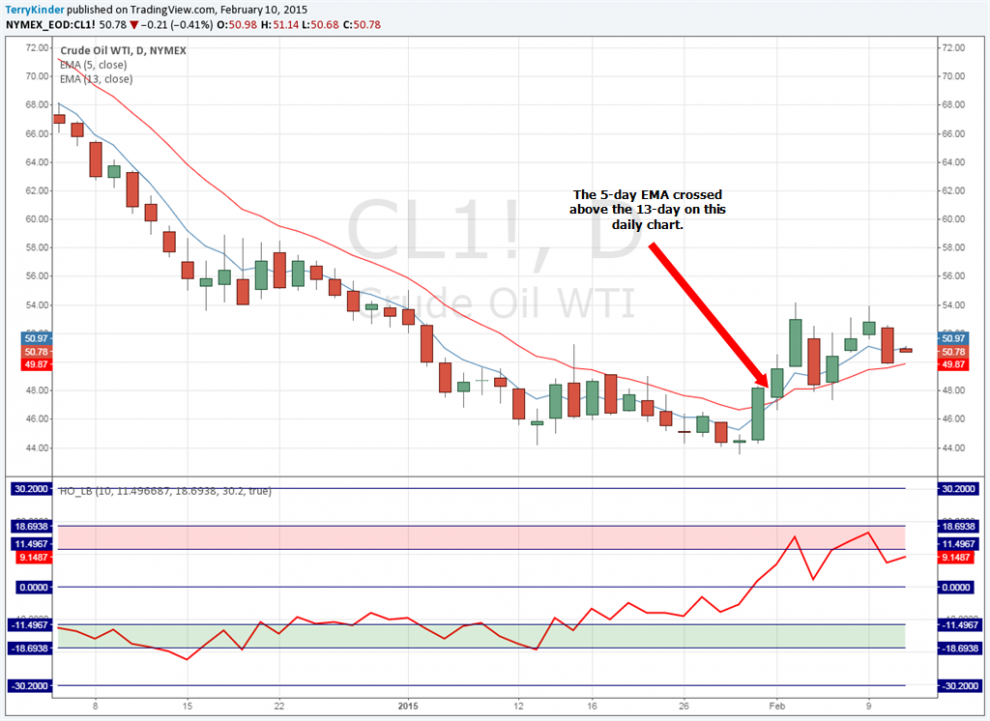
The 5-day EMA crossed the 13-day EMA on this daily chart.
In the chart above the 5-day EMA has crossed above the 13-day EMA which, at least for the short-term, is bullish. The Hurst Oscillator indicates that oil is currently near overbought as the red line is near the pink shaded area.
Term Structure indicates the directional bias for oil is up
In Term Structure – The Forgotten Piece of the Puzzle Andreas Clenow outlines how the shape of term structures can influence the directional bias of price. I won’t try to explain it here since he does a far better job than I ever could.
Mr. Clenow has set up a wonderful tool where you can examine the term structures of everything from soybeans to live cattle and from treasuries to currencies. Gold, silver and much more are included as well – about any futures contract you can imagine.
His tool indicates over the short, medium, and long-term what the directional bias of the price will be. Below is the term structure curve for oil.
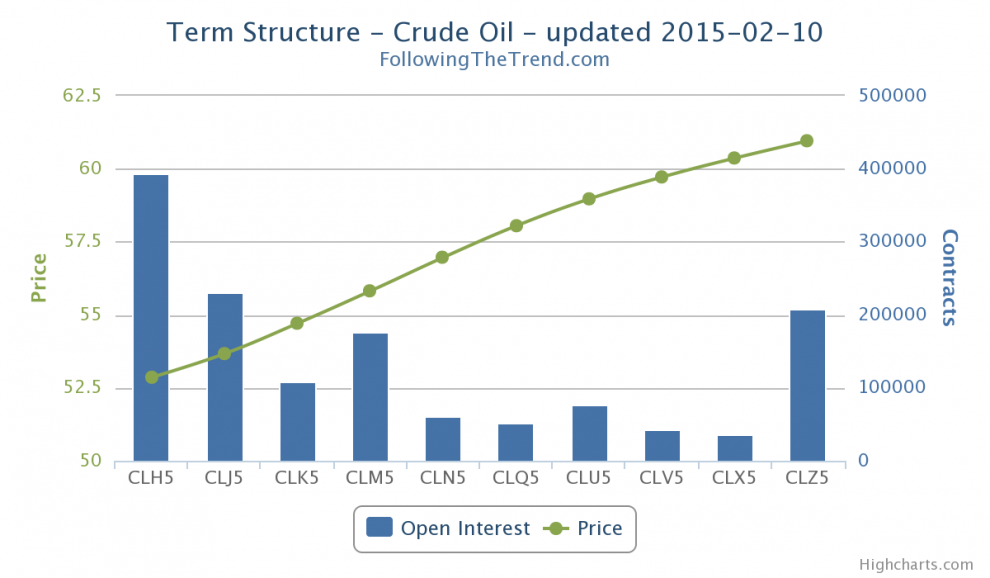
The term structure for oil indicates that it will likely rise over the short-term. However, long-term the bias is still down.
Currently, the directional bias for oil, short-term, is higher. However, long-term the bias is still down. That probably shouldn’t be surprising given the huge drop in the oil price. It will obviously take some more time before the bias changes.
You may be wondering, why should we care about the price of oil on the futures market when there is a spot price. It’s important because the futures price tends to lead the spot price and is an important element in the price discovery process as indicated here, here and in many other studies. So, it’s quite likely that the spot price will follow the directional bias of the futures price.
Bonus Chart: A contrary view
A lot of prognosticators have made a lot of noise about $30.00 to $35.00 and even $20.00 or lower oil prices. I’m pretty skeptical of their point of view given that various support levels have held for oil thus far. But, what would it look like if the 2008 six standard deviation oil price collapse were repeated?
Here’s what a repeat of the 2008 6 standard deviation collapse of oil would look like.
If such a collapse were to occur then a sub-$20.00 oil price would be possible. Could happen and will happen, of course, are two totally different things.
Conclusion
Technical analysis is a many splendid thing. Peter L. Brandt, using purely technical analysis, predicted $50.00 to $59.50 oil on 23 October 2012, 23 June 2013, and 23 November 2014. It’s just one more sign of the strength of technical analysis versus fundamental analysis.
In case you’re wondering, the price of oil on those dates, respectively, was $87.70, $94.32 and $93.96. I can’t personally think of anyone who made a better call on oil than Brandt did.
Yes, technical analysis has its challenges. Some who are practitioners of technical analysis simply deploy the tools incorrectly or try to bend the chart to fit their preconceived notions. However, the same can also be said for some who practice fundamental analysis. While Clenow is correct that there is a fringe element of technical analysis, I don’t necessarily agree that I, or any other technical analyst needs to make it a personal crusade to correct their errors or spend a lifetime disavowing them. I believe creating good, useful and accurate technical analysis and teaching others to recognize it when they see it. I think spending too much time highlighting poor analysis only serves to spread it and creates the impression that the fringe is a bigger element than it actually is.
With regards to oil, the price has, so far, been resistant to fundamental analysis that says it must drop to $30.00 to $35.00 or below. While I would never say that such a price drop can’t happen (that’s a sure way to insure it does), I stand by what I have written above. Oil, at the moment, could sustain a drop a bit below $47.00 and not necessarily fall further. However, a clear break below that level could mean a trip down to $37.45. Should that level break then $15.89 would be the next target.
Many people missed the turn down in oil. There certainly was a lot of arm waving in the not too distant past about how the price of oil would never drop below $100.00, then $90.00, then $80.00 per barrel. The fundamental analysis, as I recall had something to do with peak oil or commodities markets, or something fundamental. Of course the difficulty with fundamental analysis is coming to some kind of agreement on what is fundamental and what is not.
I prefer to use the yardstick of price which encapsulates the knowledge of millions of people rather than rely on the ever-changing opinions regarding what is fundamental. Technical analysis isn’t perfect. Nothing is. But, Peter Brandt did a pretty good job foreseeing the oil price drop back when many practitioners of fundamental analysis were saying such a price drop simply couldn’t happen.
Bullion.Directory or anyone involved with Bullion.Directory will not accept any liability for loss or damage as a result of reliance on the information including data, quotes, charts and buy/sell signals contained within this website. Please be fully informed regarding the risks and costs associated with trading in precious metals. Bullion.Directory advises you to always consult with a qualified and registered specialist advisor before investing in precious metals.


