

London Trading Leapt on End-2015 thanks to December 2015’s double-bottom at $1045
 Bullion.Directory precious metals analysis 29 January, 2016
By Adrian Ash
Head of Research at Bullion Vault
Says who?
Says the London bullion market, that’s who.

For all the bluster about China “taking over” in gold, London’s five clearing banks did 3.5 times the volume traded on the Shanghai Gold Exchange in 2015.
And turnover amongst those 5 banks – clearing physical bullion trades in London vaults on behalf of the world’s wholesale market – leapt over 36% in December from November 2015, new data showed Friday.
That was the biggest month-on-month jump in volume by weight since May 2010.
Oddly enough, May 2010 was the last time the US stockmarket did as badly as it just did in January 2016. Gold, on the other hand, just capped its 4-year bear market with its best monthly rise in 12, gaining 4.8% as the S&P lost 5.6%.
So what? Well, volume matters, because crowd behaviour reveals itself in the quantity of stuff being bought and sold – and when the crowd all chooses to trade, it pays to take note.
That’s why Elliott Wave theory looks at volume to check the pattern it sees on financial price charts. Any price movement with relatively high volume is seen as stronger, more relevant, explains Investopedia, than a move made on weak turnover.
Equally, “Declining volume is often a warning that [a] trend is near completion,” adds author and tutor John Murphy, while “a solid price uptrend should always be accompanied by rising volume.”
So most telling, therefore, December’s heavy trading came after the weakest volume in London’s bullion market for a decade.
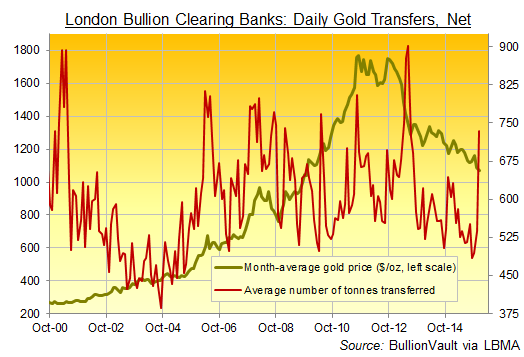
This chart shows month-average prices. And after rising for 11 years running, gold prices fell into a bear market lasting more than 4 years so far, losing 40% from the summer 2011 peak.
But signs are, the selling exhausted itself as winter drew on. December 3rd saw gold fall to $1045 per ounce, a level it then touched again on the 17th to create a so-called “reversal pattern” known as a “double bottom”. In the parlance of technical analysis it was then confirmed when gold rose and held in January above the mid-point between those two lows at $1088.
Technical analysts and traders have clearly bought into this confirmation, pushing gold prices higher from end-2015’s new 6-year lows as the stockmarket slumped in New Year 2016.
But longer-term investors might want to take note as well.
Because the $1045 low – a level long identified as a key point by bullion-market insiders – came after gold trading bullion had slowed to decade lows, only to jump as that double bottom formed.
For now, at least, gold selling by Western money managers and big investors looks exhausted. Maybe more buying will follow. Especially if the stockmarket’s change of trend worsens as well.
Bullion.Directory or anyone involved with Bullion.Directory will not accept any liability for loss or damage as a result of reliance on the information including data, quotes, charts and buy/sell signals contained within this website. Please be fully informed regarding the risks and costs associated with trading in precious metals. Bullion.Directory advises you to always consult with a qualified and registered specialist advisor before investing in precious metals.


Leave a Reply