

Feb 13 2017
| Gold Weekly Close | DXY Weekly Close | US2Y Weekly Close | US10Y Weekly Close |
|---|---|---|---|
| $1,234.70 | 100.71 | 120 bps | 241 bps |
| US Real Rates Weekly Close | 1D Z-Score | 1W Z-Score | TrendFlex Alert |
|---|---|---|---|
| 2 bps | 0.84 | 0.4 | YES |
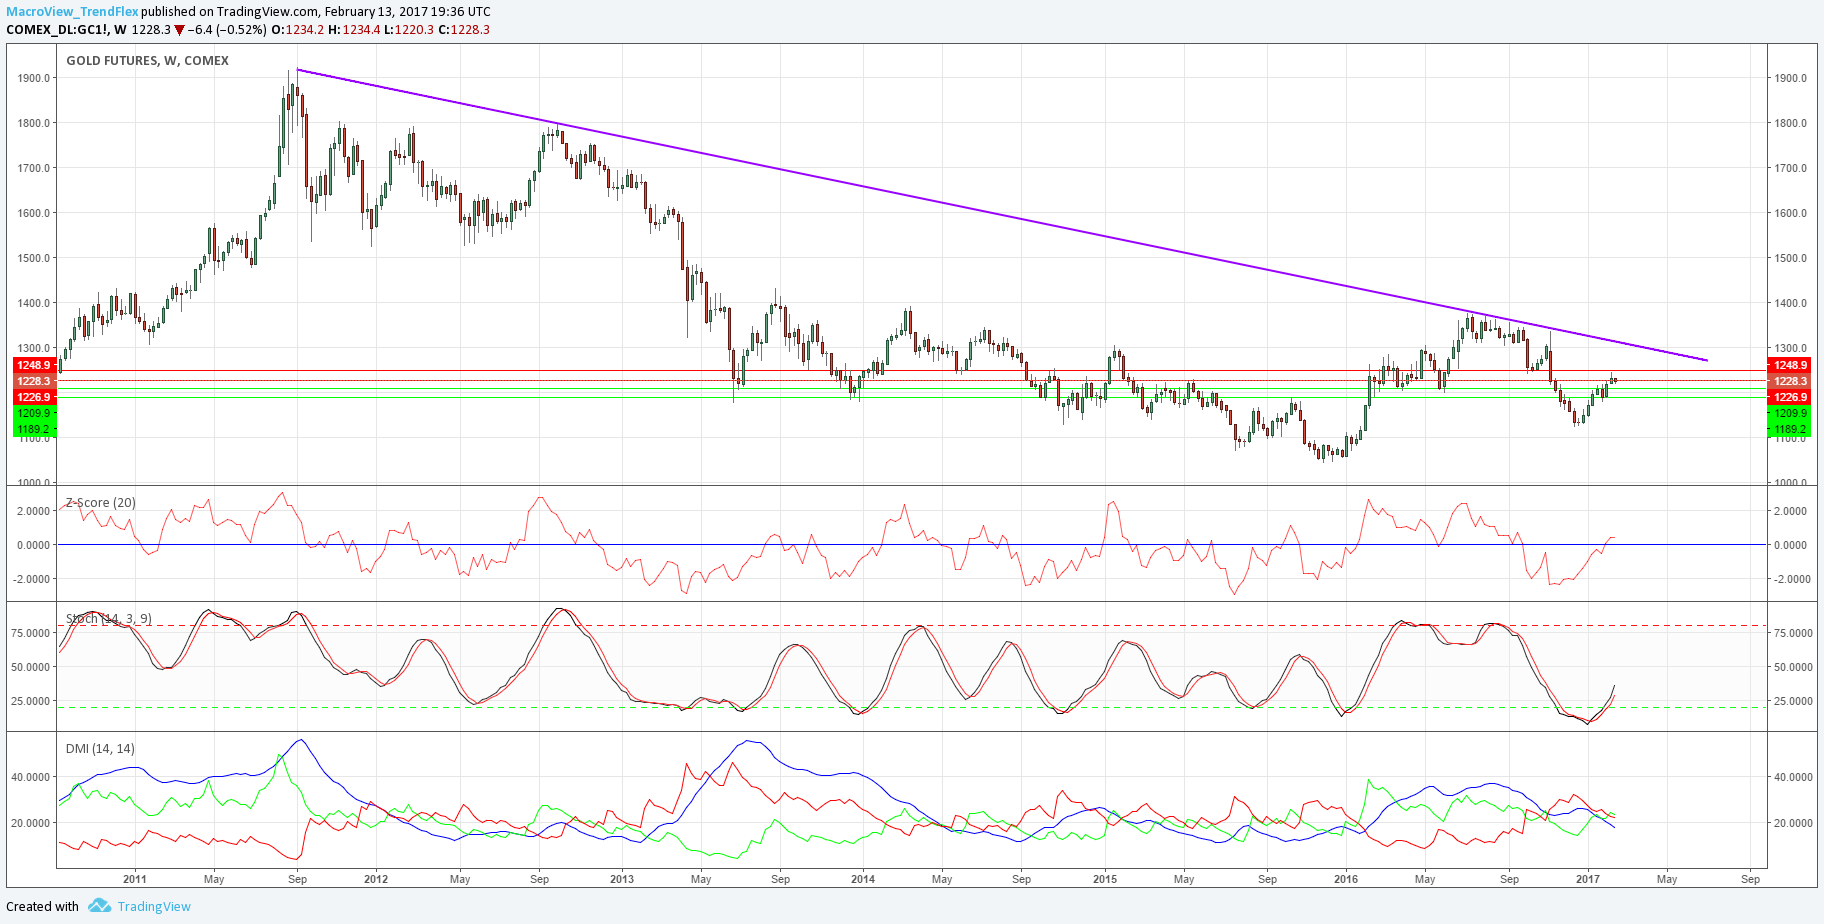
Gold finished strong last week as price action climbed higher and narrowly missing our R2 level of $1,248 – achieving a weekly high of $1,246.6. Despite the strong sentiment around global equities (primarily fueled by retail buying), gold is still outperforming the S&P 500 thus far into 2017.

The 1D z-score has eased from the beginning of last week, 1.58 v .84. This is healthy as traders take profits and digest the 2.8 percent gain in February (from last week’s high). Due to the modest technical positioning of gold and weekly z-score of .40, gold still remains attractive aside from the pure global political uncertainty.
Trader net-positioning in gold futures – on a 5-year percentile – is still inching higher despite record levels in U.S. stock indexes.
In our “175 days” analysis, we looked at the U.S. 2-year yield and its relationship to the 2015 and 2016 “tightening” cycles and gold prices. We show that in each cycle, the U.S. 2-year yield from trough-to-peak (December 2015 Fed rate hike) was 175 days.
The 2-year yield then declined into 2016 for 175 days before the yield went from trough-to-peak (December 2016 Fed rate hike) which was exactly 175 days.
MacroView believes that we could be seeing similarities in yield behavior as the U.S. 2-year yield has been weaker post-December rate hike. This is not concrete evidence that this yield won’t march higher, but it is a representation of market psychology.
This is important as the U.S. 2-year yield is most closely tied into monetary policy thus tied into the dollar’s performance. A weaker 2-year yield generally equals a weaker currency thus boosting gold prices.
Since the Fed hiked interest rates in December gold is up 9.1 percent (as of writing this report). It has also erased nearly 50 percent of losses, following bullish ramp in U.S. yields last June (incidentally exactly when hedge funds became the most net-long gold since 2011).
On a technical perspective, if $1,226 support breaks that price action will likely test $1,215. Our key levels remain the same.
Key Weekly S/R Levels
![]()
Bullion.Directory or anyone involved with Bullion.Directory will not accept any liability for loss or damage as a result of reliance on the information including data, quotes, charts and buy/sell signals contained within this website. Please be fully informed regarding the risks and costs associated with trading in precious metals. Bullion.Directory advises you to always consult with a qualified and registered specialist advisor before investing in precious metals.


Leave a Reply