

Selling six sigma events, such as stock market crashes, is often used to promote alternative investments. But how likely are six sigma events?
 Bullion.Directory precious metals analysis 15 September, 2014
By Terry Kinder
Investor, Technical Analyst
A good explanation of standard variation can be found here. A standard deviation is represented by the Greek letter sigma:
In statistics and probability theory, the standard deviation (SD) (represented by the Greek letter sigma, σ) measures the amount of variation or dispersion from the average.[1] A low standard deviation indicates that the data points tend to be very close to the mean (also called expected value); a high standard deviation indicates that the data points are spread out over a large range of values.

A normal standard distribution sigma curve is below:
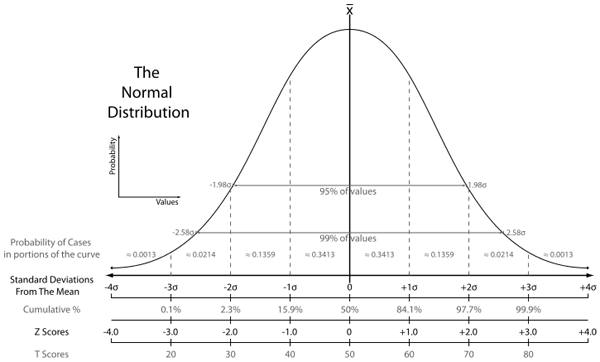
You’ll notice that the normal distribution curve of sigma only covers 1, 2, and 3 sigma events. So according to this curve:
So, only 0.3% of the time will an index, stock, etc. deviate four sigma or four standard deviations – or higher – from the mean. This assumes a standard normal distribution which, in the case of the S&P 500, is not true:
As you can see, the overwhelming majority of daily returns fall within one standard deviation, or sigma, from the mean return of 0.03% per day. This is actually a characteristic not discussed as frequently as the stock market’s “fat tails.” Namely, that daily returns are leptokurtic until you reach the tails. Yet, the normal distribution holds that ~68% of returns should occur within one standard deviation of the mean, yet the actual number is a gigantic 95.6%.
In fact, from January 3, 1950 to July 31, 2012 there were only 16 six sigma (or higher) own days and 8 six sigma up (or higher) days on the S&P 500. Jason Voss, CFA explains further:
For example, from 3 January 1950 through 31 July 2012, the average daily return of the S&P 500 was 0.03%, and the standard deviation was 0.98% (source: Yahoo Finance, CFA Institute). These results are remarkably similar to the mean and standard deviation of the normal distribution of 0 and 1, respectively. This suggests that daily returns for the S&P 500 closely approximate the normal distribution, and that returns follow a random walk.
So, the S&P sigma numbers above are based on the average daily return. But what is the likelihood of a 3, 4, 5, or six sigma event given a normal distribution curve?
in every three years;
day in 126 years (!);
13,932 years(!!)
every 4,039,906 years;
Returning to the S&P 500, six sigma and higher events are measured in years rather than days. Take a look at the article linked above and find the table re-scaled in years. At six sigma or higher, the shortest amount of time for a six sigma event is over 6 years and the longest wait would be over 60 years.
So, if you are waiting for a six sigma event, you’re probably going to be waiting a while. You’ll wait even longer for anything beyond six sigma. Given the unlikelihood of six sigma events, just how much time and resources should you spend planning for them? Some of that will depend on the amount of wealth you are protecting. Large amounts of wealth, or inter-generational wealth, may require more elaborate plans. In that case, it could well be worth considering six sigma events since the time horizon is longer and the amount of money at risk is likely quite large.
What if you are middle-class and are not wealthy? Well, it depends. Part of amassing wealth requires you to protect the wealth you have from loss. Some things to consider are:
For most of us, timing the markets is extremely difficult. So one viable strategy would be to follow Harry Browne’s Permanent Portfolio which allocates your wealth as follows:
How / why does the Permanent Portfolio work?
Browne’s highly original insight was to link specific asset classes with four basic economic conditions:
1.Prosperity is good for stocks and bonds.
2.Recession is good for cash.
3.Deflation is good for bonds and cash.
4.Inflation is good for gold.
Conclusion:
Rather than try to outsmart the markets and divine the timing of six sigma events, the Permanent Portfolio helps you protect and grow your wealth in nearly any market condition. Yes, six sigma events are frightening and they do help to sell lots of alternative investments.
However, rather than trying to predict where the markets will go next, it is probably better for most people to protect their wealth by spreading their assets out over cash, gold, stocks, and treasuries (or some variation of them) in order to better ride out the financial storms, including six sigma events.
Bullion.Directory or anyone involved with Bullion.Directory will not accept any liability for loss or damage as a result of reliance on the information including data, quotes, charts and buy/sell signals contained within this website. Please be fully informed regarding the risks and costs associated with trading in precious metals. Bullion.Directory advises you to always consult with a qualified and registered specialist advisor before investing in precious metals.


Leave a Reply