

With a seemingly endless stream of bad news regarding the oil price, could next week mark the reversal higher for black gold?
 Bullion.Directory precious metals analysis 16 March, 2015
By Terry Kinder
Investor, Technical Analyst
I n investing, as in nature, running with the herd is a good way to either get trampled or picked off by predators. Oil, more and more, is beginning to give the appearance of being one such market, where, if you listen to the perfectly coiffed pundits on TV, not only will you lose your shirt, but you’ll help add additional silk shirts and ties to their ample collection of designer fashion filling their spacious walk-in closets.
For months, a chorus of market mavens has sauntered forth to dictate their message to the financial media – the price of oil must drop to $35.00, $30.00, nay, to $25.00 or even $20.00 per barrel. The low price thus far has been $43.58. Should these mavens lose their jobs as pundits, perhaps a career as a government economist beckons.
Without a doubt the price of oil could fall further. With the price of oil currently resting slightly below a long-term support line dating back to 1999, should enough pressure be placed on the price, it could decline significantly and sharply. On the other hand, as we shall see, the decline in oil is already of similar magnitude to the price drop of 2008-2009. Should we, for example, expect oil to suffer a decline that is one standard deviation, or more, greater than the precipitous 2008-2009 decline? In the final analysis it will be the market, not some analyst du jour on tout TV, that will determine just how much farther the oil price will decline.

Oil: The Long-Term View
The oil price is currently near its long-term support line
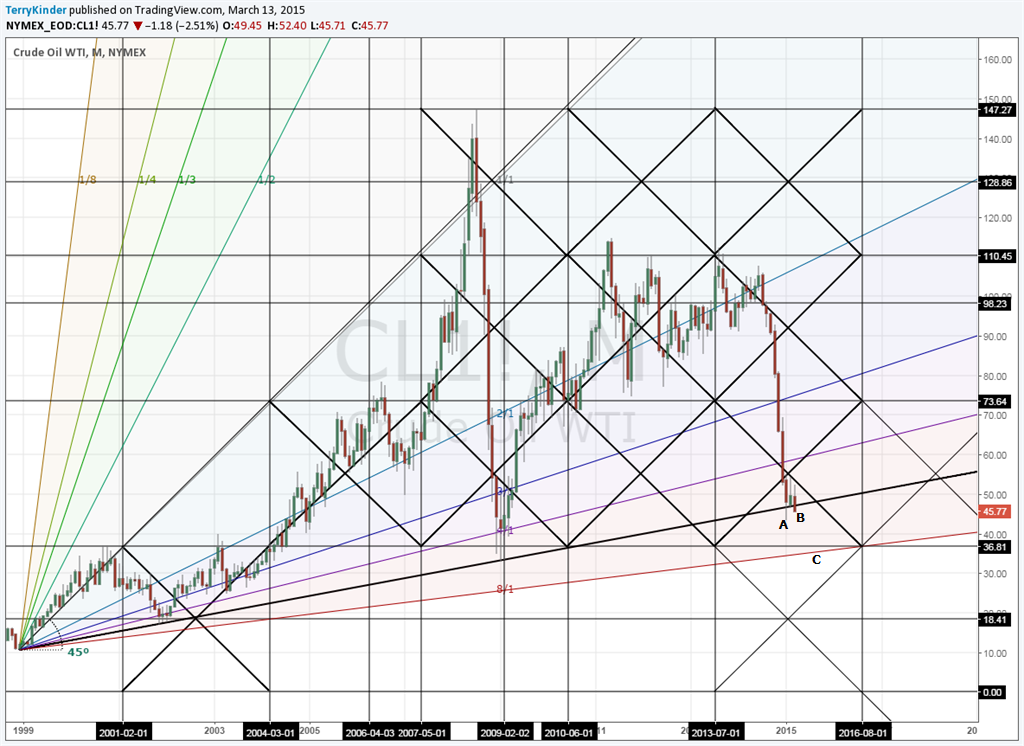
On our first chart, the oil price is currently near it’s long-term support line. Well, it’s actually below the support line. This also occurred back in January when oil made a low of $43.58, but had a monthly close above support.
Some interesting features of this chart are:
- The low price marked by the letter A;
- Current oil price at B is below long-term support line which dates back to 1999. However, this also occurred back in January where the support line was violated, but price finished the month above support;
- The oil price should have additional support near C, which translates to roughhly $34.50 – $35.00 currently.
Clearly, we need to be aware of the precarious situation facing the oil price. If the long-term support line is violated, where is the next point where the price might find support?
Oil Price Support and Resistance Pivots
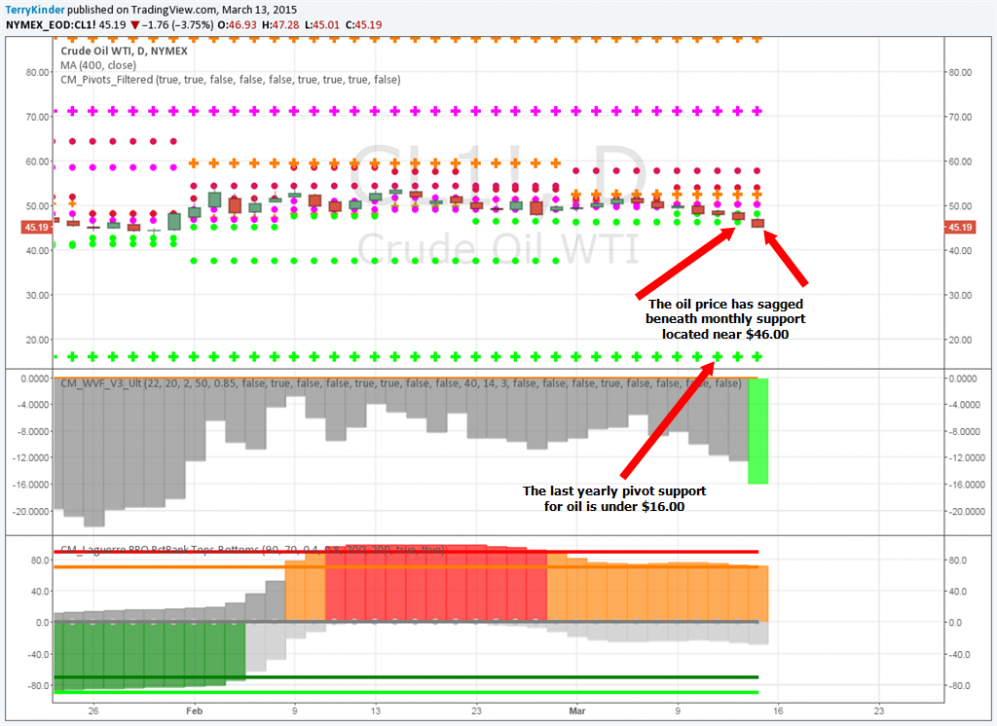
Oil is currently below it’s monthly pivot of near $46.00
The oil price has slipped pretty significantly on Friday the 13th. It moved near $45.00, down over 4%. That means the price has slipped below monthly support near $46.00. There is a weekly support for this week (16 March 2015) near $40.00. The only yearly support level left on the chart for oil is below $16.00 – not that oil is likely to fall that low, but it’s important to know where all of the support levels are.
Oil Chart With Additional Support and Resistance Lines
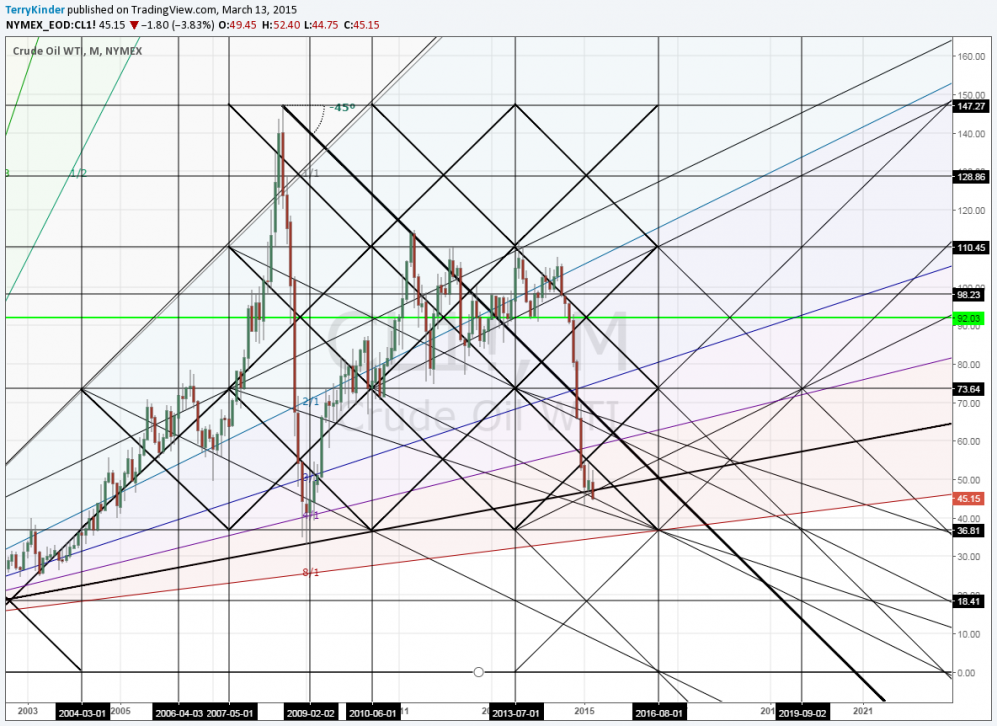
Oil price chart with additional support and resistance lines
At this point, we’re not going to closely study the chart above. However, it’s worth studying the support lines that were added. Some of them are based on a quite important ratio that few technical analysts use, but ought to. Price will very often turn on these support or resistance lines which are based on the geometric structures you can see within the chart.
Oil: Comparing This Decline With the 2008-2009 Decline
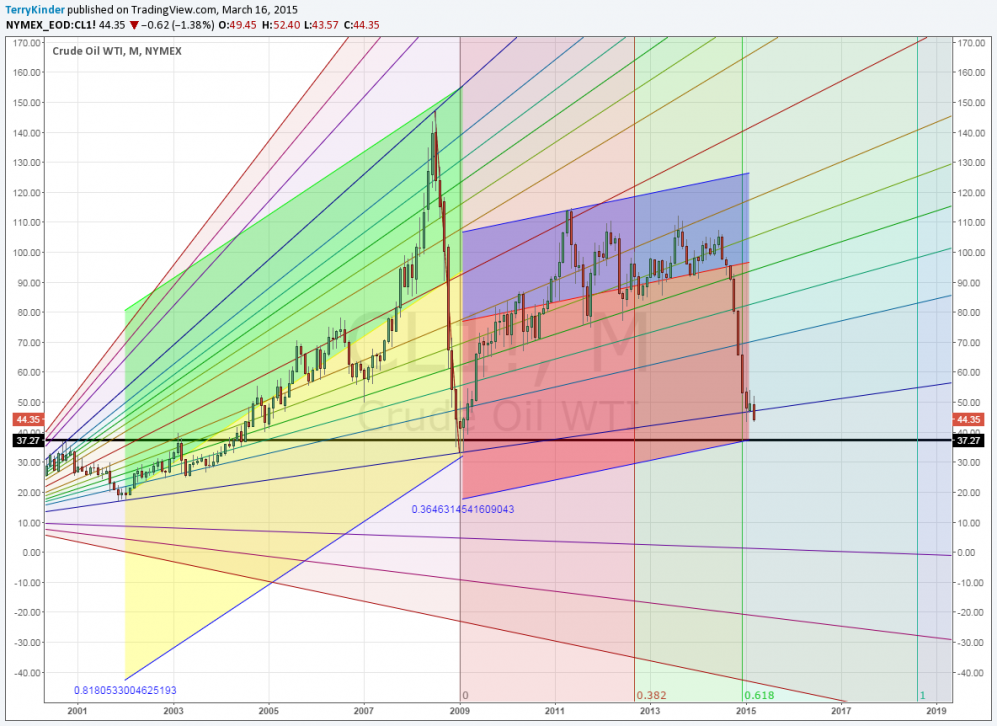
The 2008-2009 oil decline brought the price down 4 standard deviations from its base line. A move lower to $37.27 now would equal that decline.
The last big decline in oil during 2008-2009 amounted to a 4 standard deviation move from its base line to the low price. Should oil decline to $37.27 this time around, that would equal a 4 standard deviation move from its base line. About a 15% decline from current price levels would bring the WTI price to $37.27, so we’re not that far away from equaling the decline, in terms of standard deviation, that we saw back in 2008-2009.
A Prediction on When the Oil Price Will Turn Higher
Well, if you have made it this far, then this next point may interest you. When will the oil price reverse? If the calculations have been made correctly (we aren’t going to get into how they were made just yet, perhaps another day), then a low in the oil price should be made around Thursday the 19th of March. Yes, it’s that close, despite much speculation to the contrary. One thing we can’t know yet is whether the low represents “the low” or an interim low. We won’t know for certain until we can look backwards at some point in the future.
In the meantime we could see the oil price under quite a bit more pressure. It’s possible that the price will be pushed down quite sharply from now until 19 March. It wouldn’t be surprising if we were to see several days of prices moving 5% or better next week. This is, by no means, predicting such price swings will happen, rather just pointing that out as a possibility.
UWTI For the Rebound
UWTI, the 3x long crude ETN, has been viciously hammered lower after it had a brief rebound in late January and into February.
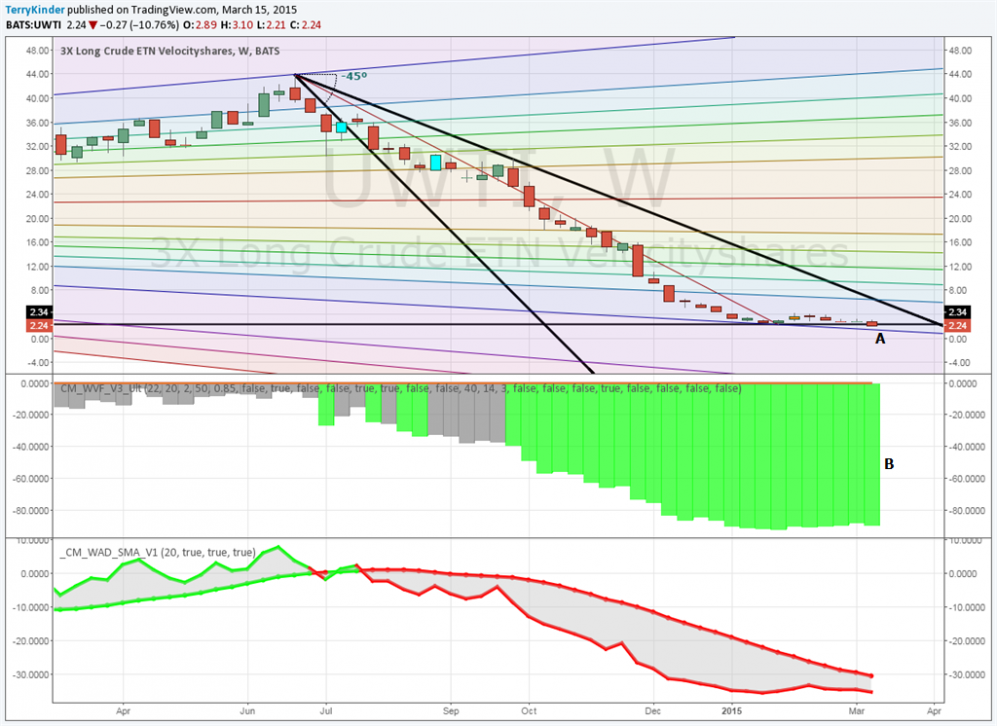
UWTI price is approaching Pitchfan support at A and Williams Vix Fix levels looking near point of rebounding higher soon
Noteworthy features on the UWTI chart are:
- Price is approaching near Pitchfan support at A;
- Williams Vix Fix looks to be putting in a bottom at B, implying UWTI will move higher.
Conclusion
Should the price of WTI crude oil reverse higher, as anticipated, around Thursday 19th March, then UWTI could prove a relatively low cost way to profit from a rebound in price. As always, be aware of the risks involved in investing in UWTI by reading the prospectus In addition, before making any investment, always seek the advice of a licensed, professional investment adviser and be sure to conduct your own due diligence.
Bottom line: There appears to be a good probability that West Texas Intermediate crude oil will make at least an intermediate bottom – perhaps a long-term bottom later next week. If price deteriorates further, there should be fairly solid support between $34.50 and $35.00. The UWTI 3x long crude oil ETN might prove a relatively low cost way to take advantage of a turn higher in the crude price.
Bullion.Directory or anyone involved with Bullion.Directory will not accept any liability for loss or damage as a result of reliance on the information including data, quotes, charts and buy/sell signals contained within this website. Please be fully informed regarding the risks and costs associated with trading in precious metals. Bullion.Directory advises you to always consult with a qualified and registered specialist advisor before investing in precious metals.


