

If you look at the oil price measured in grams of gold, the price may be at or near a bottom
 Bullion.Directory precious metals analysis 9 February, 2015
By Terry Kinder
Investor, Technical Analyst
I always find arguments around dollar-based pricing fascinating. It seems that, when it’s convenient, some argue that the dollar is useless and shouldn’t be used as a yardstick for anything. At other times, with the oil price for example, those same critics are more than willing to use the oil price if it furthers their narrative of crashing oil prices.
Interestingly, I haven’t noticed any recent pieces (I may have missed them) analyzing the price of oil against the price of gold. I’m going to assume, for now, that using gold as a yardstick is fairly uncontroversial within the gold community.
There has been a seemingly endless stream of stories out of both the so-called mainstream media and alternative media pushing the narrative that the oil price must plunge to $30.00 – $35.00. CNBC, especially, has been beating this meme to death. So, when the alternative and MSM both are pushing the same story, it immediately sets off my BS detector.
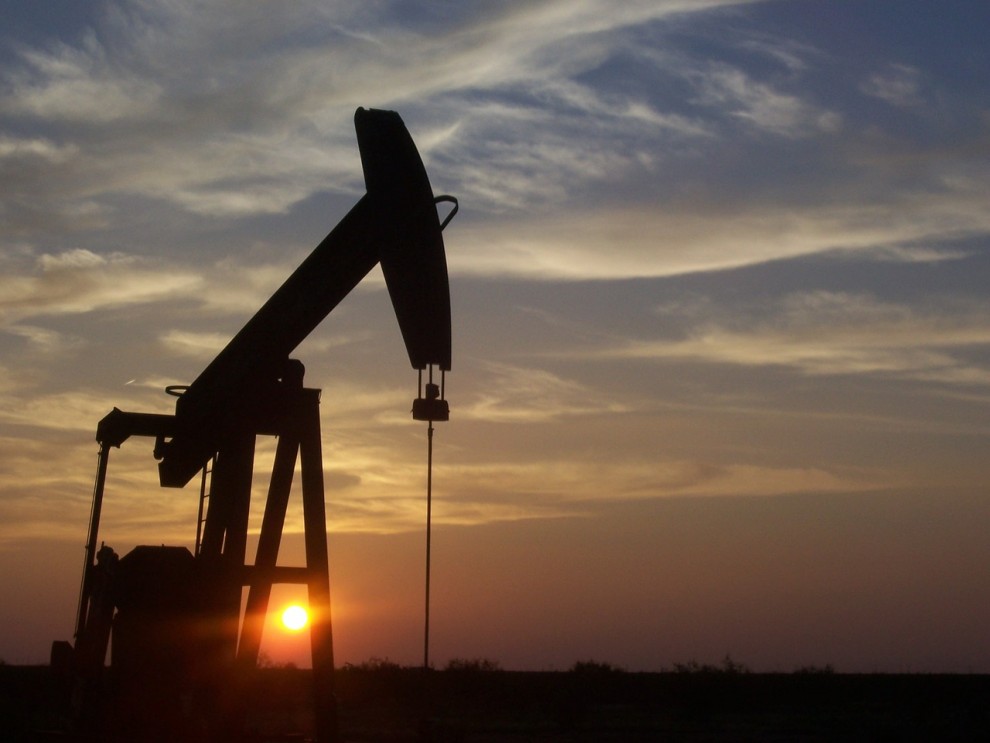
Oil, when priced in gold, may be at or near a bottom. Image: pixabay
Now, from the CNBC side of things I have a theory on why the $30.00 – $35.00 oil story continues to be flogged to death. My theory is that some big investors were short and got caught by surprise when the oil price reversed. So, CNBC, is being used as an outlet for those short oil to try and manipulate the price lower so they can get out of their positions. Sound familiar?

Don’t misunderstand. I’m not saying CNBC is somehow involved in this other than just providing traders with a platform to express their point of view. Whether the people they interview are expressing their true point of view is on the traders, although I would hope CNBC both asks tough questions and offers people with a contrary view the chance to express it on their network.
So, back to the oil price. One very good source of information for prices in terms of gold is Priced in Gold. Some of the information below is based on their oil charts.
If we measure WTI crude in gold grams rather than dollars we get an interesting result. Since 1950, when the price of West Texas Intermediate (WTI) crude oil falls to near 1 gram of gold (priced in dollars) per barrel, it typically means that the price is near a bottom. The only exception to this was a brief period in the 1970’s.
So, how much is the price of gold per gram? Currently it is approximately $39.92 per gram. On 29 January 2015 the price of oil fell to $43.58 and then bounced higher. So, on that date, a barrel oil came to within 8.398% of its price being equivalent to a gram of gold.
For the price of oil reasonably to fall further to $30.00 to $35.00 per barrel, one or the other of the following things has to happen:
1) The price of gold falls in dollar terms, making it possible that oil priced in gold grams can fall and still be at or above 1 gram of gold per barrel of oil, or;
2) The oil price has to fall below one gram of gold per barrel of oil – something it has only done once between 1950 and today.
Below is an oil chart I have been watching for some time.
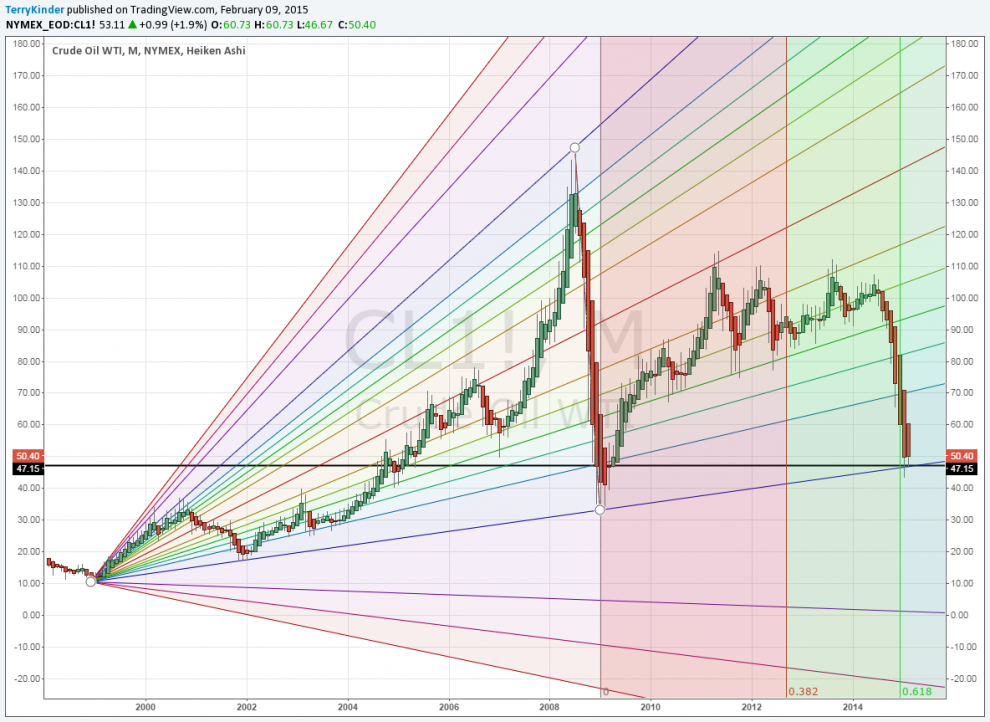
Oil has found support at the same level multiple times on this chart.
As you can see, the oil price has touched support multiple times and managed to hold above it. That doesn’t mean that price won’t break through support. In fact, the more times price tests support, generally, the better chance it has of breaking it. However, it hasn’t managed to do so up to now.
The oil price, as with the gold price and many other prices, is cyclical. It trades within a range and over longer periods finds support at certain levels. Whether you look at the crude price through the lens of grams of gold, or examine it using a Pitchfan as in the chart above, the support and resistance levels become clear.
Instead of accepting the narrative that oil must fall to $30.00 – $35.00 per ounce without question, I encourage you to examine the crude price and price cycles – whether measured in dollars or grams of gold, both paint a similar picture. The oil price could fall further, but to do so either the gold price must fall, or oil must fall to below one gram per barrel – something it has only done briefly since 1950.
Note: Gold price per gram for this article from Goldpriceoz.com.
Update 10 February 2015:
1) Surely a sign of the Apocalypse, Jim Cramer offered 2 Signs That Oil Has Already Bottomed based on charts from the Fibonacci Queen;
2) David Linton of Updata offered an optimistic sounding update on oil. Oil is first update so check it out.
3) Via Economic Policy Journal: Layoffs in the Oil Sector in Perspective.
Bullion.Directory or anyone involved with Bullion.Directory will not accept any liability for loss or damage as a result of reliance on the information including data, quotes, charts and buy/sell signals contained within this website. Please be fully informed regarding the risks and costs associated with trading in precious metals. Bullion.Directory advises you to always consult with a qualified and registered specialist advisor before investing in precious metals.


