JNUG ETF: Some weeks you are the windshield, some weeks you are the bug. The short version of my week – I was the bug.
 Bullion.Directory precious metals analysis 17 October, 2014
By Terry Kinder
Investor, Technical Analyst
In my previous JNUG ETF investor’s diary I wrote about tornadoes, cycles and volatility. While the tornado didn’t carry me off to Oz, the continued JNUG volatility did give me a nice kick in the pants to end the week. 
JNUG ETF: Some weeks you are the windshield, while others you’re the bug. This week, I got another turn at being the bug. Image: pixabay
So, how bad was the week? The JNUG ETF finished the regular trading session down $0.81 or -7.53% for the day. Overall the investment is down 11.76% which is better than the -26% it was at a few days after I purchased it, but still not what I wanted to see.
The JNUG ETF closed at exactly the important $9.94 level. JNUG spent a good deal of the week bouncing between the $10.00-$11.00 range. There are actually three important levels worth keeping an eye on:
$9.94$10.75$11.58Thus far, JNUG has failed to reach the $11.58 level, but did move above $10.75. If the JNUG ETF fails to hold the $9.94 level, then the next price levels of concern would be $9.17, and $8.43. $8.43 was the low point for the current cycle so far, so hopefully that price level stays in the rear-view mirror.
Before the weekend festivities begin, let’s take a quick look at the daily and weekly JNUG ETF charts and see what we can figure out.
JNUG ETF Daily Chart
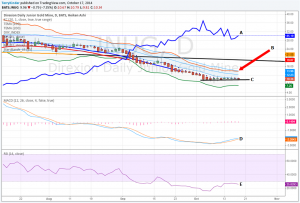
JNUG ETF Daily Chart: The week didn’t go as well as I would have liked, but it wasn’t a complete disaster either.
Here are a few important features from the JNUG ETF Daily Chart above:
A – US Dollar Index (DXY) price moved up to about $86.74 and has moved down from there. My expectation, based on past patterns, is that as the JNUG price moves higher, the DXY price will move lower. At some point, the JNUG and DXY prices will cross on the overlay. That is to say, they won’t cross at the same price level, but will cross paths on the chart;B – Starc + (plus) Band is beginning to exit out of the blue shaded Keltner Channels. When the Starc + Band falls into the Keltner Channel this means there is strong downward price pressure. As this price pressure eases, the Starc + Band rises and exits the upper band of the Keltner Channels;C – The JNUG ETF price has started to level off, showing just the tiniest upward slope. This usually occurs soon before the price reverses higher. Also of note, the JNUG price is getting close to re-entering the Keltner Channels. When the price is below the Keltner Channels it indicates a strong downtrend in price. The JNUG price is now either consolidating or near the point of consolidating. If the price would move into the Keltner Channels that would provide a little bit of reassurance that the price trend is reversing, although that by itself is certainly no guarantee of a reversal;D – MACD has experienced a bullish crossover but still remains far below the zero line. Once MACD crosses above the zero line the upward price movement should accelerate;E – The Relative Strength Index (RSI) still remains oversold. This probably won’t last much longer, but you never know.JNUG Weekly ETF Chart
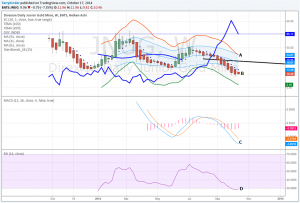
JNUG ETF Weekly Chart is looking better than before.
Here are a few important features from the JNUG ETF Weekly Chart above:
A – Starc + Band it right on the edge of the upper part of the Keltner Channels. If the Starc + Band dips down much more it would be a sign of strong downward price movement and that would not be good;B – The JNUG ETF price is still below the Keltner Channels which shows there is still some downward price pressure on a weekly basis. The price does appear to be looking a bit flatter. Another interesting aspect of the JNUG price is that it has shown downward momentum now for 13 weeks as indicated by the Heiken Ashi red candles. This is the longest streak of Heiken Ashi red candles that JNUG has ever had. However, this isn’t a complete surprise. Over time, JNUG price declines have taken a longer amount of time while price increases have occurred over a shorter and shorter time period. If you look at the first down/up cycle it had eight red candles followed by 11 green ones. The next cycle had 12 red candles followed by 6 green candles. This current cycle has 13 red candles so far;C – The MACD is still far under the zero line and experiencing a bearish crossover;D – RSI is still oversold on the weekly chart but has been moving up recently.
Perhaps someday the JNUG ETF will let me be the glorious windshield rather than the poor splatted bug. Image: pixabay
Conclusion:
It was a tough week to be holding the JNUG ETF. Definitely the kind of week where I felt like the bug that went splat rather than the windshield cruising down the highway. That’s just the way things go sometimes.
Stay tuned for JNUG ETF: An Investor’s Diary Part 5 to see if I get a turn at being the window or yet another chance to be the bug.
Links to other investor’s diaries in this series:
Part 1
Part 2
Part 3
Part 5
Part 6
Part 7
Part 8
Part 9
 This license allows for redistribution of this article, commercial and non-commercial, as long as it is passed along unchanged and in whole, with credit to Bullion.Directory, linking to the original article.
Bullion.Directory or anyone involved with Bullion.Directory will not accept any liability for loss or damage as a result of reliance on the information including data, quotes, charts and buy/sell signals contained within this website. Please be fully informed regarding the risks and costs associated with trading in precious metals. Bullion.Directory advises you to always consult with a qualified and registered specialist advisor before investing in precious metals.


Leave a Reply