

JNUG ETF: Tornadoes, Cycles and Volatility oh my!
 Bullion.Directory precious metals analysis 14 October, 2014
By Terry Kinder
Investor, Technical Analyst
JNUG ETF: Tornadoes, Cycles and Volatility oh my!
Image: Pixabay
After plunging as low as $9.27, resulting in a 26% loss, the JNUG price ran up to $11.87, temporarily putting the entire position in the black.
JNUG ETF: Rocco before the stormy weather. Image: Silvia Kinder
By the end of the day price had dropped to $10.88, resulting in a small overall loss for the investment through yesterday.
Today the price action of the JNUG ETF was just as wild. The price opened the day at $10.70 and fell down as low as $9.50. At one point in the day it stood at $11.27 before finally finishing in after hours trading at $9.99. So, at this point my position is down 11.23% after being down over 26% during the day yesterday.


This volatility in the JNUG ETF demonstrates why it is so important to understand the instrument you are investing in. You prepare for volatility like you would prepare for bad weather. In the case of a possible tornado, you keep an one eye on the local weather and the other on the sky. In the case of your investment you do your homework, understand your investment risk, volatility, price cycles, and other factors which could adversely affect results. You watch over your investment and look to see if anything unexpected occurs and evaluate whether or not it changes anything about your investment thesis or not.
In JNUG ETF: An Investor’s Diary Part 2 we spent quite a bit of time discussing just how volatile JNUG is.
In that diary I also mentioned that I had been following the JNUG ETF for some time and had begun to view its price through the lens of price cycles.
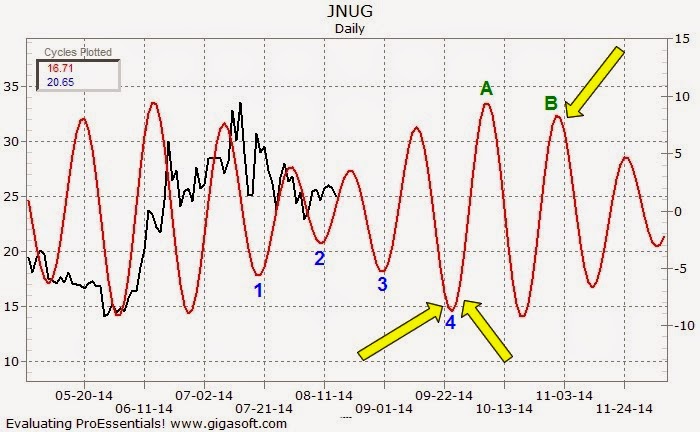
JNUG ETF: My first public chart outlining the price cycles in the JNUG ETF.
Well, JNUG is something I have been watching for some time. One place I first noticed some posts about the JNUG ETF was The Daily Gold. It seemed intriguing, so I posted about it over at the gold and silver community where I am one of the moderators.
Over time my thinking on JNUG began to evolve from looking at the investment through the lens of Point and Figure Charting to viewing it from the perspective of price cycles.
So, how did all of this price cycle business and its association with the JNUG ETF begin?
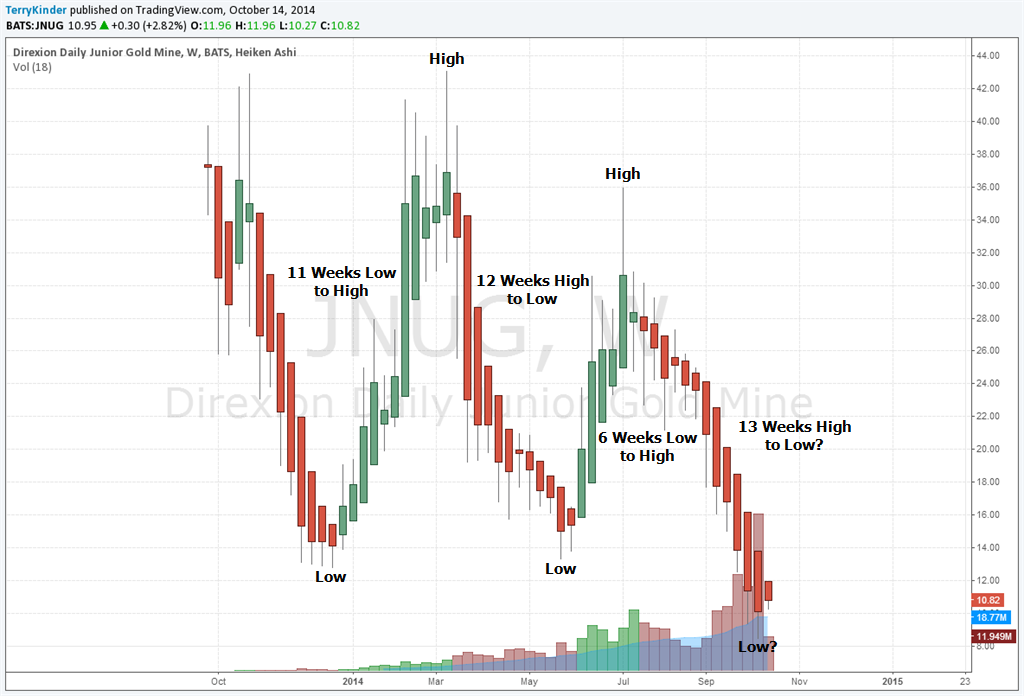
JNUG ETF: Some price cycles can be spotted by the naked eye.
Interestingly, looking at the JNUG ETF price cycle, you’ll notice that the up cycle has gotten shorter while the down cycle has lengthened. Overall, however, the cycle length hasn’t changed much. The current JNUG price cycle still isn’t certain yet, although it does appear to have bottomed. So, this price cycle, if it holds, could end up being 19 weeks instead of 23.
Before wrapping this investor’s diary up there is one bit of unfinished bit of business from the previous one. I promised to teach you a simple technique to forecast pivot high and low prices. Unfortunately, the JNUG ETF does not currently provide a good example of that. However, I would refer you to the post on the GDXJ. Since the JNUG price mirrors the price of the GDXJ, only with three times leverage, knowing that the GDXJ has bottomed should also give a pretty good indication of when the JNUG ETF will bottom as well.
Conclusion:
The technical analyst, like the meteorologist, spends his time attempting to predict the seemingly unpredictable.
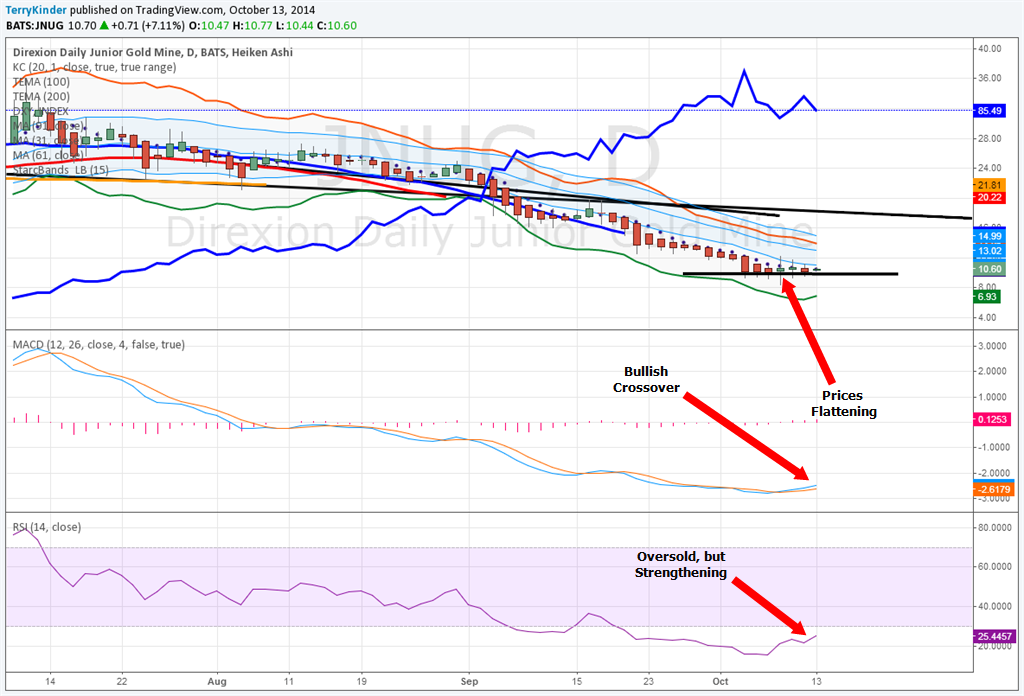
JNUG ETF: With prices flattening, MACD looking up, and RSI strengthening has the storm passed?
Stay tuned for JNUG ETF: An Investor’s Diary Part 4 to see if the price volatility has passed or whether the investment has been wrecked by the storm.
Links to other investor’s diaries in this series:
Part 1
Part 2
Part 4
Part 5
Part 6
Part 7
Part 8
Part 9
Bullion.Directory or anyone involved with Bullion.Directory will not accept any liability for loss or damage as a result of reliance on the information including data, quotes, charts and buy/sell signals contained within this website. Please be fully informed regarding the risks and costs associated with trading in precious metals. Bullion.Directory advises you to always consult with a qualified and registered specialist advisor before investing in precious metals.


Leave a Reply