

Come with me down the rabbit hole of Phi Circles and Fibonacci Spirals
 Bullion.Directory precious metals analysis 27 February, 2015
By Terry Kinder
Investor, Technical Analyst
Down the rabbit hole we go.
Alice was beginning to get very tired of sitting by her sister on the bank, and of having nothing to do: once or twice she had peeped into the book her sister was reading, but it had no pictures or conversations in it, `and what is the use of a book,’ thought Alice `without pictures or conversation?’

I can’t guarantee how sparkling our conversation here will be, but at least you’ll get pictures.
So she was considering in her own mind (as well as she could, for the hot day made her feel very sleepy and stupid), whether the pleasure of making a daisy-chain would be worth the trouble of getting up and picking the daisies, when suddenly a White Rabbit with pink eyes ran close by her.
Follow me down the rabbit hole Image: pixabay
There was nothing so very remarkable in that; nor did Alice think it so very much out of the way to hear the Rabbit say to itself, `Oh dear! Oh dear! I shall be late!’ (when she thought it over afterwards, it occurred to her that she ought to have wondered at this, but at the time it all seemed quite natural); but when the Rabbit actually took a watch out of its waistcoat-pocket, and looked at it, and then hurried on, Alice started to her feet, for it flashed across her mind that she had never before seen a rabbit with either a waistcoat-pocket, or a watch to take out of it, and burning with curiosity, she ran across the field after it, and fortunately was just in time to see it pop down a large rabbit-hole under the hedge.
In another moment down went Alice after it, never once considering how in the world she was to get out again.
The rabbit-hole went straight on like a tunnel for some way, and then dipped suddenly down, so suddenly that Alice had not a moment to think about stopping herself before she found herself falling down a very deep well.
Like Alice, we won’t pause to think before leaping, feet first, to follow the rabbit down the hole. Let’s begin.
A little explanation
Let’s start straight away with my disclaimer. This charting technique I’m using is highly experimental. It’s actually a chart created over at TradingView with an overlay from PhiMatrix. So, there may be some imprecision in my application of the overlay.
To pick the best alignment I created two Fibonacci Spirals. One spiral on each chart starts at the pivot low and ends at the high. The second spiral starts at the pivot high price and ends at the pivot low. The price spike on each chart occurs within a shape that looks like an eye turned on its side. That is the area I believe that the interaction of the various spirals provide the impulse that propels the gold price higher.
To keep things simple we’re going to look at our charts in two-dimensions. However, I believe that price action is happening within something more like a three-dimensional sphere. The various spirals and circles push, pull, attract and repel the gold price. The most important feature of the chart is in the middle in what looks like an eye turned sideways. This appears to be the location within the sphere where the various forces apply upward force to propel price higher.
Gold 1979-1980
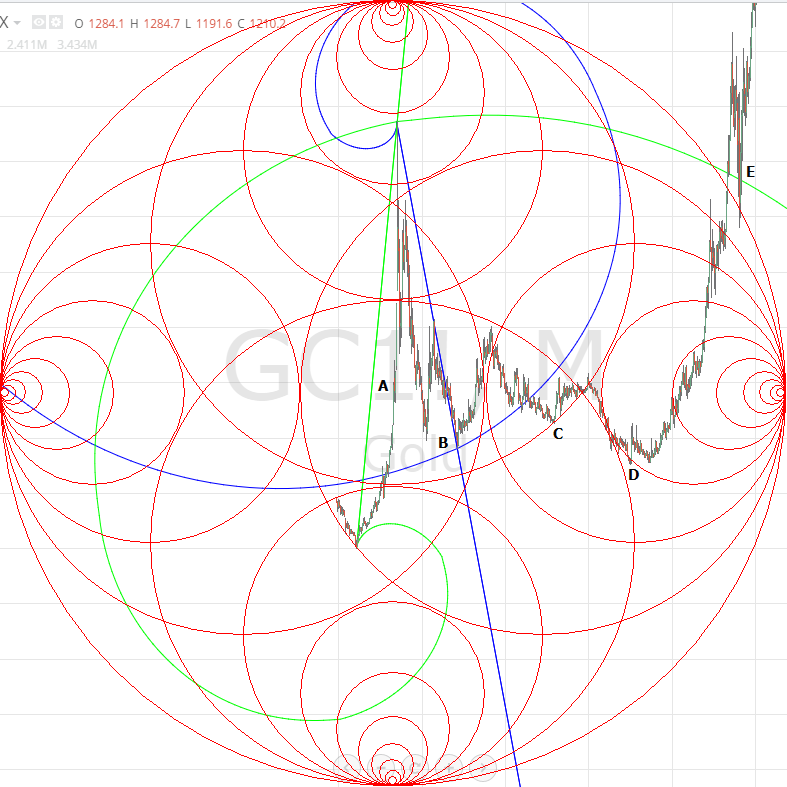
Down the rabbit hole we go with Phi and Fibonacci Spirals
Our first chart starts with the gold price near the middle of our sphere. At point A the price has bounced off the bottom of one of the Phi Circles and moved up rapidly through our sideways eye, which is simply the area where two large Phi Circles overlap.
After rising to $873.00 in January of 1980 the gold price falls to point B which is a pivot low. The blue Fib Spiral is based off this price move.
Between B and C the price moves higher after bouncing off of the blue Fib Spiral. It nearly rises to the top of a large Phi Circle, but loses momentum and drops to the bottom of another large Phi Circle.
Price bounces again at C and follows the curve of the circle up before losing momentum and falling out of it. Then price oscillates between a larger and smaller circle until it finally enters a smaller circle and bounces higher at D. At that point it makes an important pivot low and a new bull market is established.
Bull market part 2
The next chart shows the bull market that peaked in 2011. I believe that ideally this chart would show two overlapping spheres – the tail end of the previous bear market and the subsequent bull market. However, since there was no easy way to create such a chart, I have not done so. For the purposes of this discussion it was not critical to create a chart that shows the overlap.
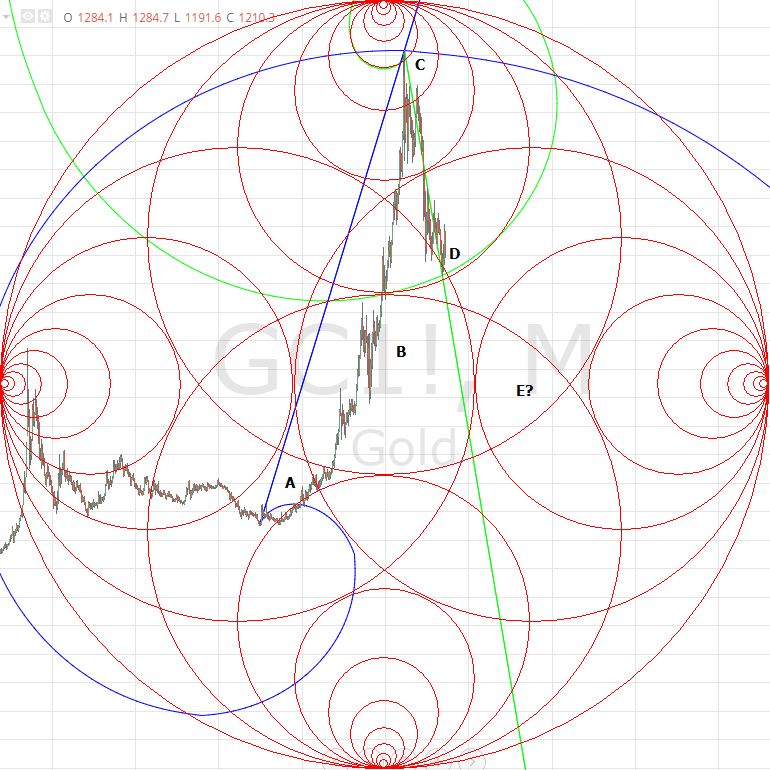
The gold price near point D is at a critical juncture
The last gold market began with the gold price moving along the edge of a Phi Circle near point A. Upon crossing into the area labeled B, the price moved up rapidly, climbing all the way to $1920.80 near point C. Point C is near both the blue Fib Spiral and a small Phi Circle.
After that the price began a relatively steep decline to point D where we are at today. At this point, the gold price is at a fairly critical juncture. Should price fall through the green Fib Spiral and the Phi Circle located right by the spiral, then gold could move down to within the area of E.
Should price move to E, it’s difficult to say how the price will track. It could either move all the way down what appears to be an eye tilted sideways or, it could move through the large circle border, diagonally down and to the right from E. Should that occur, then we could see gold price action quite similar to what took place at the resumption of the bull market seen on the first chart we looked at.
Conclusion
While this method is somewhat experimental, I believe it likely comes close to representing some of the underlying forces acting on the gold price. In reality, the mechanism is much more complex here than what has been represented. However, for the sake of time and simplicity, the process has been represented two-dimensionally.
Using a combination of Phi Circles and Fib spirals should allow us to get a fairly good bead on when the gold price has achieved a bottom which likely lies in the future rather than the past. Stay tuned for future updates.
Bullion.Directory or anyone involved with Bullion.Directory will not accept any liability for loss or damage as a result of reliance on the information including data, quotes, charts and buy/sell signals contained within this website. Please be fully informed regarding the risks and costs associated with trading in precious metals. Bullion.Directory advises you to always consult with a qualified and registered specialist advisor before investing in precious metals.


